What are Progess Bars?
Progress Bars are used to show the progress of various work items in Jira Align. You can view progress bars throughout Jira Align for a number of work items, PIs, Sprints, Reports, and so on. Progress is available in grid views as well as other pages such as the Portfolio, Program and Team Rooms.
Configuring Progress bars
To manage the Progress Bar appearance and behavior, go to Administration > Settings > Platform > Portfolio > Portfolio Specific Configuration > Progress Bars.
-
This setting is portfolio-specific: if you have more than one portfolio, you will have to update the Progress Bar configuration for EACH portfolio uniquely. After making any changes to Progress Bars configuration, logout and back in for changes to be applied.
Progress Bar configurations include:
-
Progress Bar Status: Select how your progress will be determined in Jira Align.
-
Progress View Type: Choose how you would like your progress to be displayed, either as Progress Bars or Progress Dials.
-
Progress Alert Thresholds: As time elapses for your items, you can choose for mouseover alerts to display if a minimum percentage of completed work is not met.
-
Time Elapsed row shows the % of time elapsed for the work items period . See  Configure progress bars for the details on the Time Elapsed by work item.
-
Late (%) and Warning (%) rows are the % of the work that must be completed in order to hide the color and message.
-
Progress Alert On: Select which items you would like to enable progress alerts for by selecting the checkboxes next to each item type.
Scenario:
You want work to display as Late if less than 35 percent of work is completed after 40% of a period has passed
- Calculate the % of time elapsed.
-
There are many ways to accomplish this, however for our example we will use the start and end date of the Program Increment and use the excel formula “Networkdays” to get the week days between the 2 dates, then subtract from 100%.
- Set the column showing 40% to a value of 35 for the Progress Alert Threshold, this will mark the progress as Late for any work where less than 35% of the work (Points or Count based upon your selections) has been moved to “Accepted”.
- Log out and Log back in.
- Navigate to the Feature Grid and select the correct Portfolio and Program Increment in the top navigation.
Notice how Features that are less than 35% completed show in red and when hovering over the Progress Bar, the Tooltip opens to show Late with additional information.
Viewing and Interpreting Progress Bars
To view Progress Bars in a grid view, you need to add the Progress column from Columns Shown on the toolbar.
-
Section 1 (the far left of the portion of the bar) represents work that has been Accepted and will change color based upon the values selected in the Progress Alert Thresholds.
-
Green means your item is “On Track”.
-
Yellow means your item is “At Risk”.
-
Red means your item is “Late”.
-
Section 2 (the middle portion of the bar) represents work that is being worked currently (this uses the In Progress - Test Complete State values).
-
Section 3 (the far right portion of the bar) represents work that is not yet being worked (this uses the Pending Approval and Ready to Start state values).
-
Flags / arrow indicators display if data is missing and hide if the data is present.
Example Screenshots:
Now that you set the Progress Bar Alerts it is important to understand each of the facets of the Progress Bar. In the example below we are using the same calculation for Time Elapsed as the above example.
Calculate the % of time elapsed.
-
There are many ways to accomplish this, however for our example we will use the start and end date of the Program Increment and use the excel formula “Networkdays” to get the week days between the 2 dates, then subtract from 100%.Note the sections of the Progress Bar.
Note the sections of the Progress Bar.
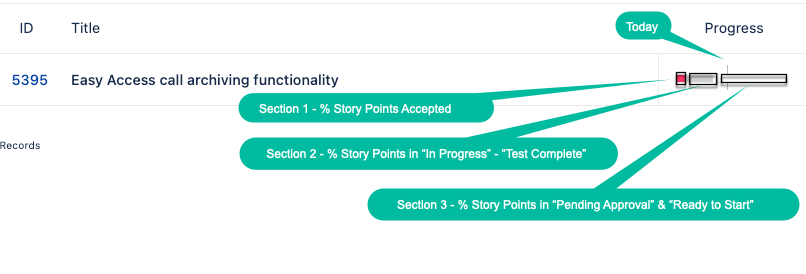
Examine a specific Feature in the Program Room to understand the bar and all of its functions.
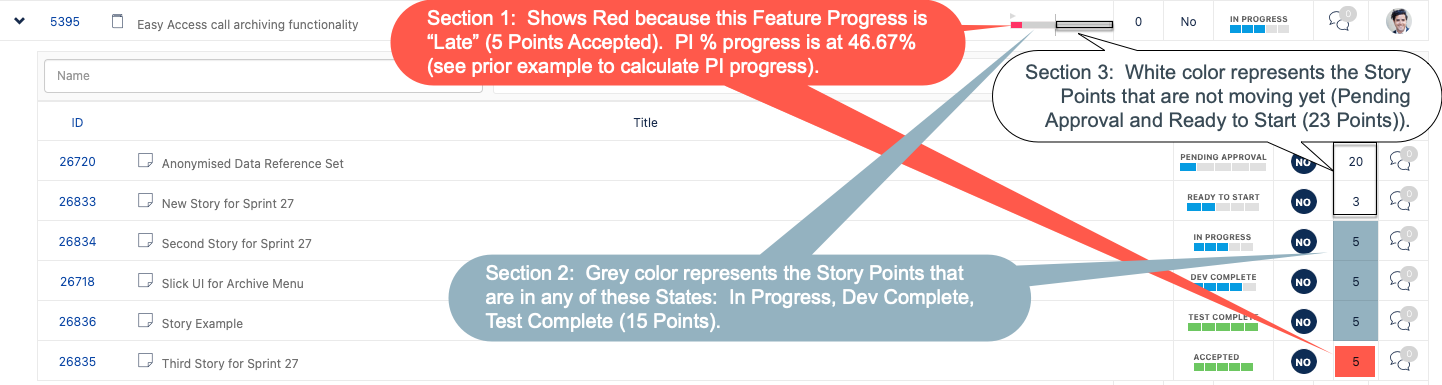
Examine a specific Feature in the Feature Grid to understand the potential flags.
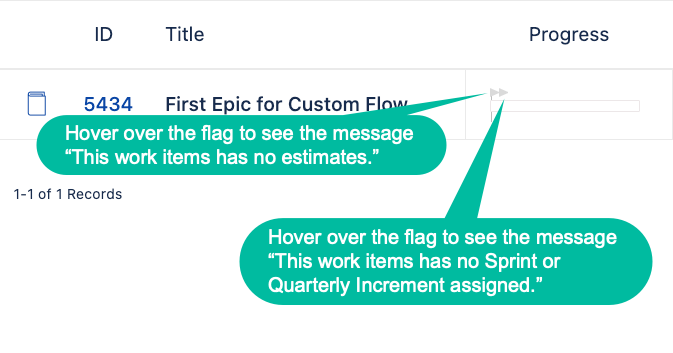
Understanding the Progress Box
Point and hover over the Progress Bar to see additional details that reflect real-time data.
-
Progress: On Track (green), Warning (yellow), Late (red)
-
State: The Jira Align State
-
Process Step: If being used
-
Percentage Done
-
Count of Story Points Accepted and Total Story Points
-
Count of Stories Accepted and Total Stories
-
Scope is an evaluation of a Portfolio/Program work item Size/Estimation and Rolled up Story Points
-
When the Portfolio/Program work item Size/Estimation is greater than or equal to the Rolled up Story Points “Scope” will be displayed and show the “Estimate of XX / YY Points”.
-
When the Portfolio/Program work item Size/Estimation is less than the Rolled up Story Points “Scope Increased” will be displayed and show the “Estimate of XX points / YY Points loaded”.
-
If the Portfolio/Program work item itself is not estimated the scope will be replaced with “No Estimate”.
-
Add Notes: This can be used to add commentary regarding the progress of the work item.
-
In order to leverage the Notes you will need to click on the actual Progress Bar before attempting to select the “Add Notes” link. The text of “Add Notes” will be replaced with the text input.
-
The Notes can only be accessed via the Progress Box.
Additional Supporting Material:
Configure progress bars
Portfolio specific configuration
Progress bars
 https://www.youtube.com/watch?v=u0MslGC2a8g
Thanks to @Michelle Jones Thompson @Steve Sauser for the collaboration


