I am struggling to create a stacked bar graph based on a simple chart.
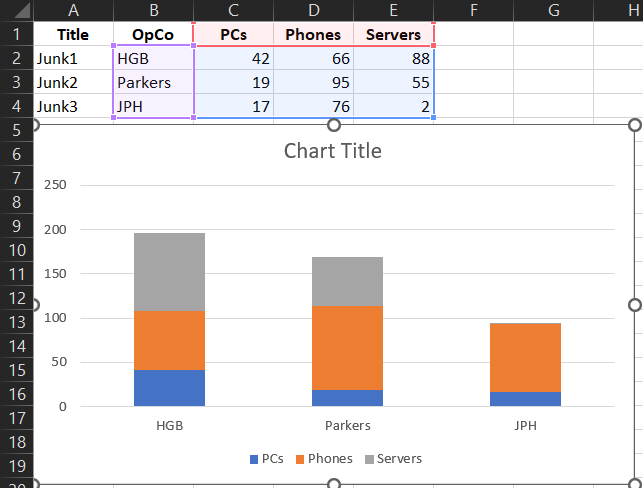
I am able to create the graph in Excel, but it seems like there is no way to do something similar in Confluence. See below for Excel chart as well as Confluence settings I'm currently trying.
Excel:
Confluence Chart Settings: 
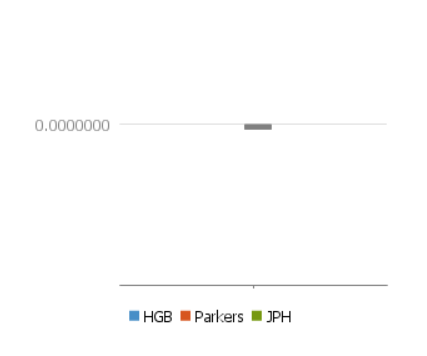
Confluence Output: