Hi,
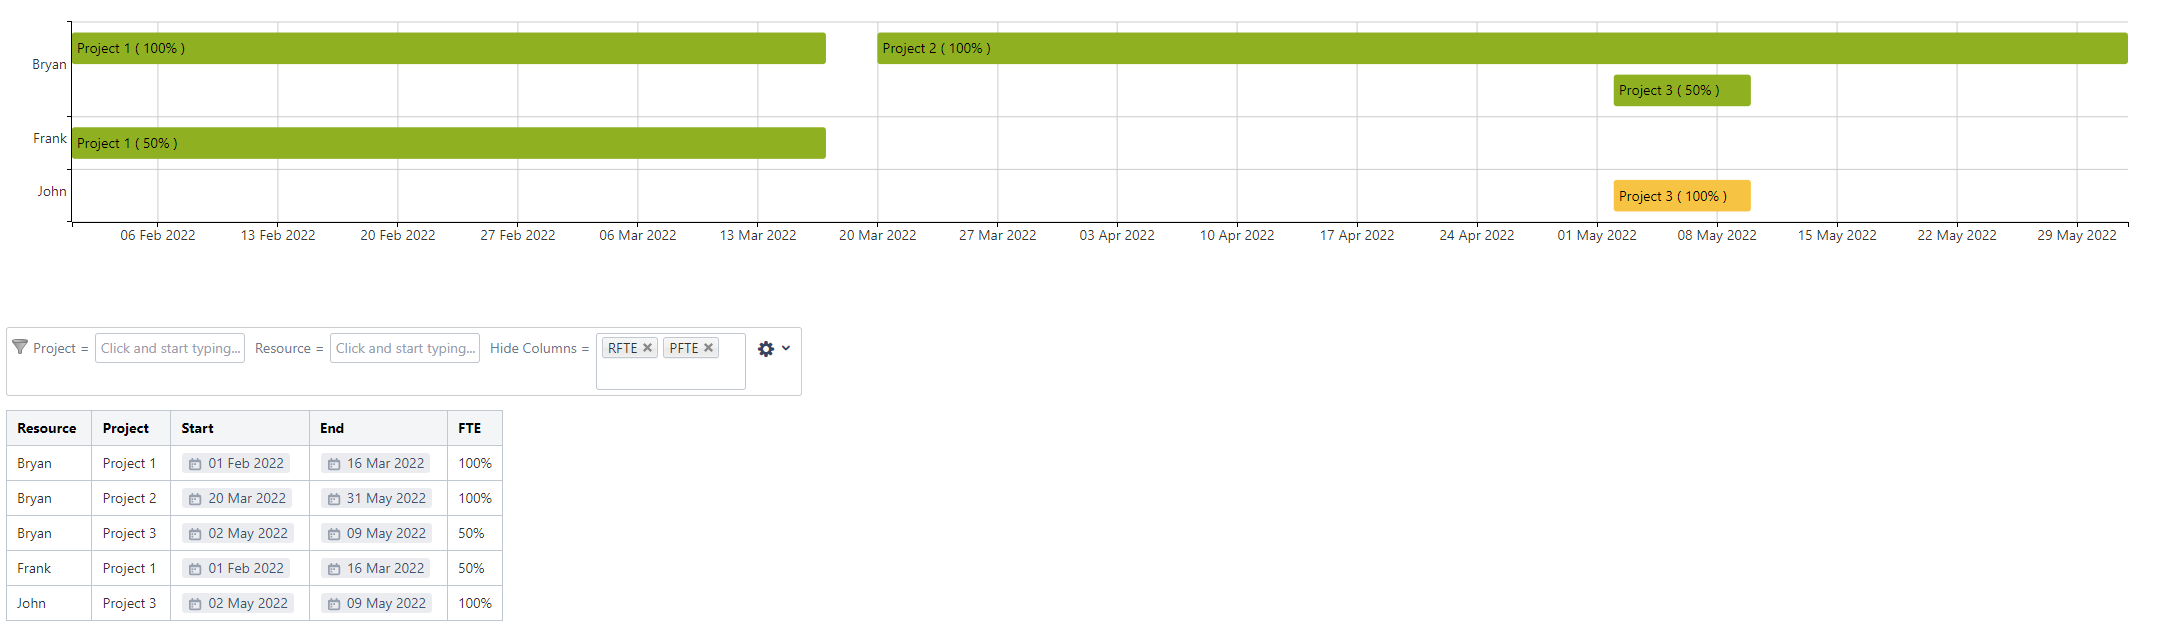
I have a table (Resource - Project - Start - End - FTE, with dummy data attached for SS purposes) where i transform some stuff on to display the attached gantt.
As you can see, my resource Bryan is over allocated between May 2nd and May 9th. It becomes quite messy to get these details when you have 50+ resources that all have 5-6 projects.
Is there a way tho stack this data into 1 bar/line where it would say 100% - 0% - 100% - 150% - 100% for the given time periods? Bonus points for styling 100%+ parts.
In SQL i would try a common table expression but when i use the WITH operator i get the following error.
e.statements[0].compile is not a function
I also tried the html macro but i'm getting nowhere for now