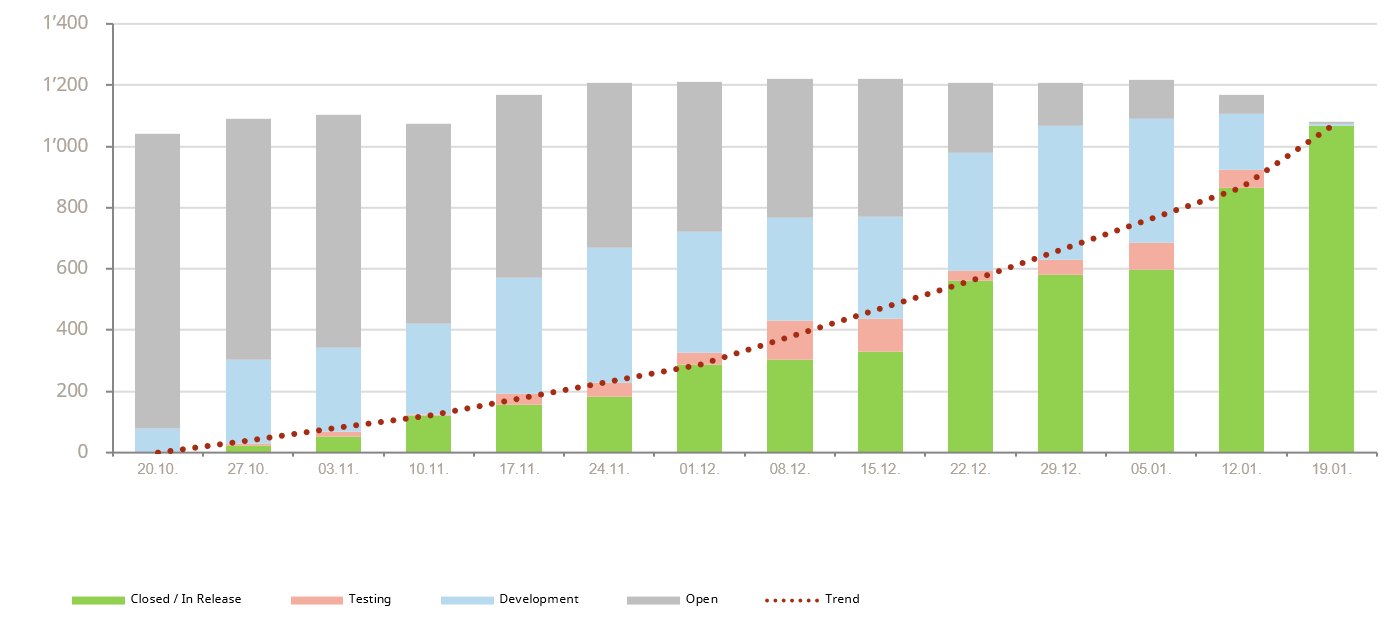
At the beginning of an increment we have a PI planning where we decide on the scope of the increment. Then we go through 4 sprints plus 1 innovation sprint to work on that scope, and then release at the end of the increment. To track progress (in story points), I have created the attached chart, which I update with weekly downloads. The chart shows:
- changes to total scope
- progress
- completion of total scope
Is there a possibility so create such a chart out of the box in Jira? So far I have only found burnups for one single sprint, or bar charts for multiple sprints. It is OK if it is much simpler, I don't need weekly snapshots, or the differentiation between different workflow statuses, values per sprint, and not completed/completed would be OK.