I am using a "table from CSV" macro which is wrapped by a "Chart from table" macro to display graphical data.
Here is one example:
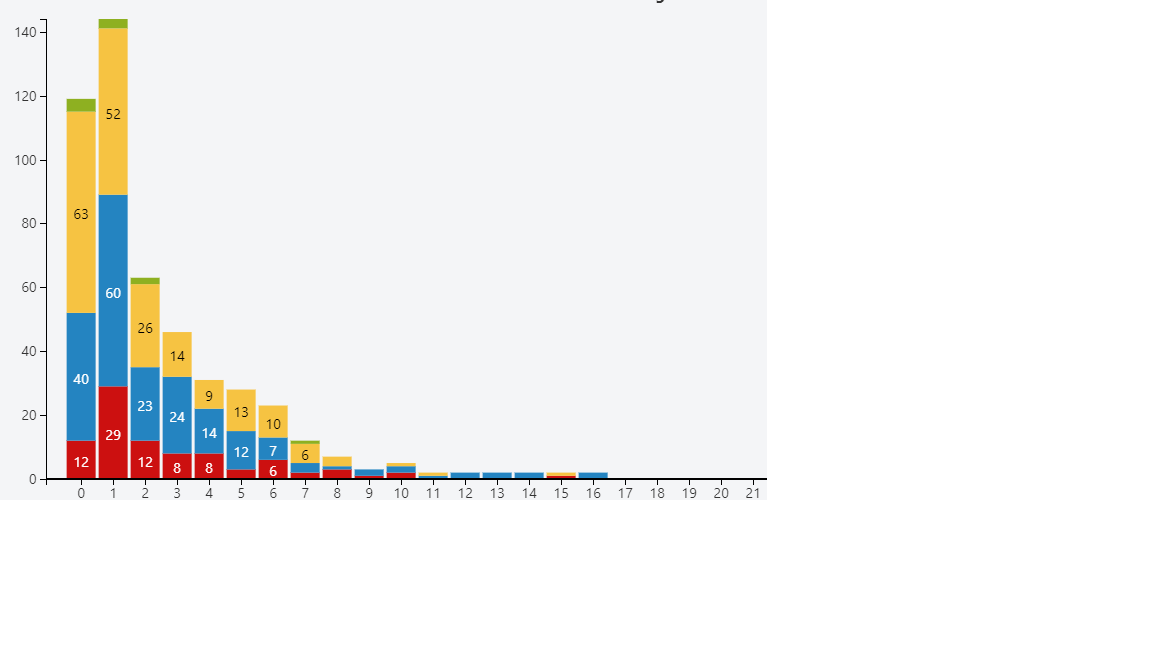
I would like to display some statistics below the graph, like Average, STD etc.
For example, I would like to calculate what percentage of all data, does value "1" account for.
Is there any way to run such calculations and display them?
Thanks


