Hi,
For confidential purpose I have created a sample that represents my problem.
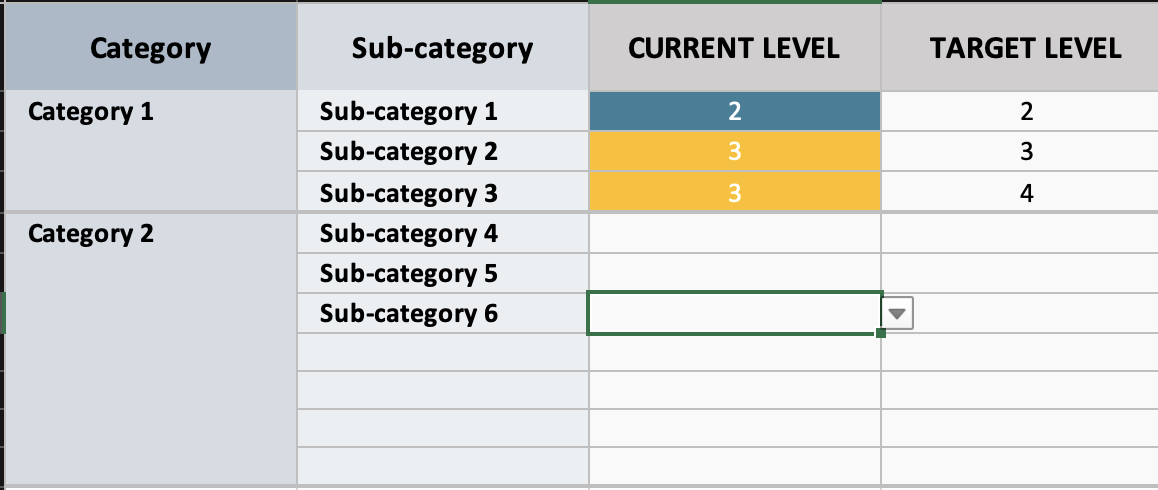
I have a table with Categories and Sub-categories, and 2 columns displaying current and target score.
I need to create a Radar chart with the Sub-Categories that have values in BOTH Current and Target Level. Radar chart has two aspects(Lines - for Current and for Target Level.
I need to create a Radar chart with the Categories with values representing the AVERAGE of the sum of each of Current level and Target level.
How can I select specific range of cells in confluence? Is it possible to interact with a particular cell using an ID (like in Excel)?
@Katerina Kovriga _Stiltsoft_ I have seen many of your responses. In this case I am using your plugin as well. Can you help?