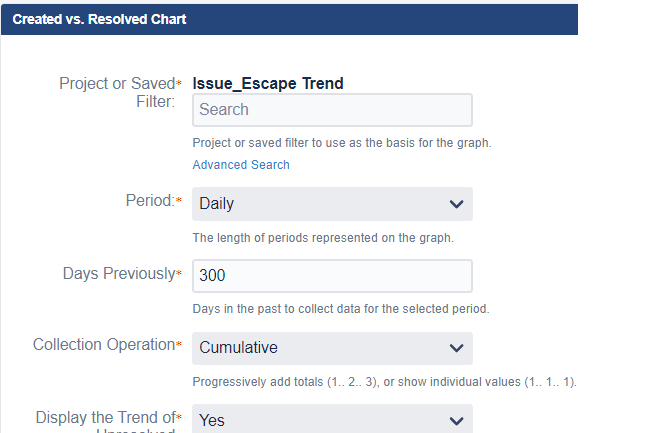
HI - Can someone please help with the Jira Dashboard gadget CREATED vs RESOLVED chart and the interpreting the trendline? Our PO wants to be sure that our query is having the same period of time for both the red and green line - If going back the max 300 days for daily progress - he does not want to see trend in negative and wants the red and green line to be the same period of time (even if considering resolving the backlog > 300 days).
- Can this be modified in the filter query? I am trying to have a createdDate be the same period to show the 300 days and need help with syntax - for instance, using TODAY (-300)Days ? I tried Created >= -300D but didn't work so need syntax help
Does anyone have another useful gadget to show stability of issues/defects trends ?
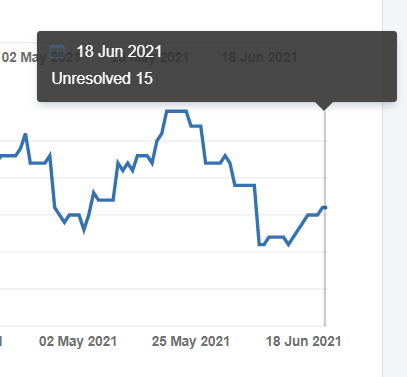
2) also in pic when you hover over last day it doesn't give the count for today (6/23)- it is showing a few days back as last date (6/18) when there is data after. Known defect ?