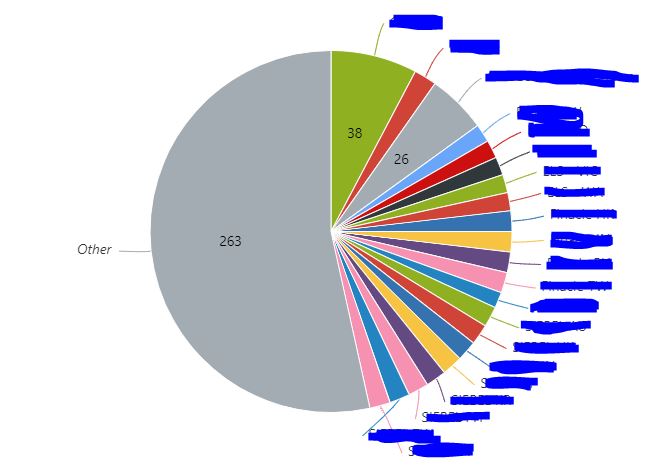
I am using Chart from table macro, however the pie chart is not showing all values, i.e. some values seems to be grouped together in a slice labeled as "Other". Why is this the case and how can I configure it to show ALL values?. Refer to attached screen shot.