Hello,
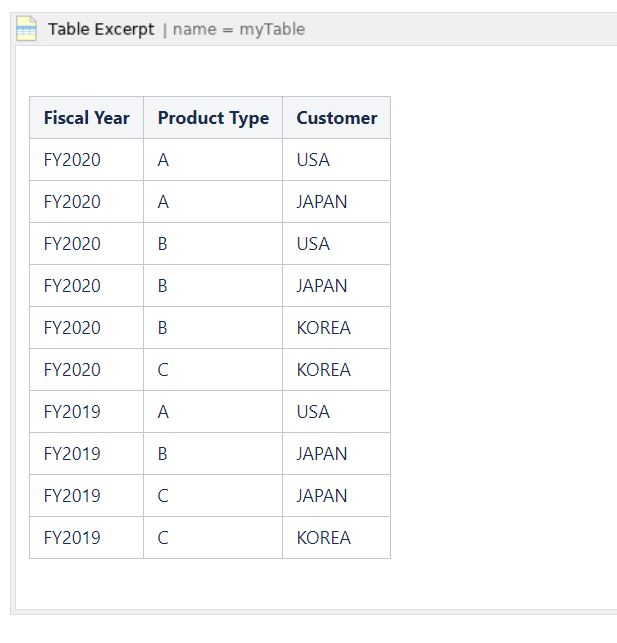
I have a table that has products sold on yearly basis.
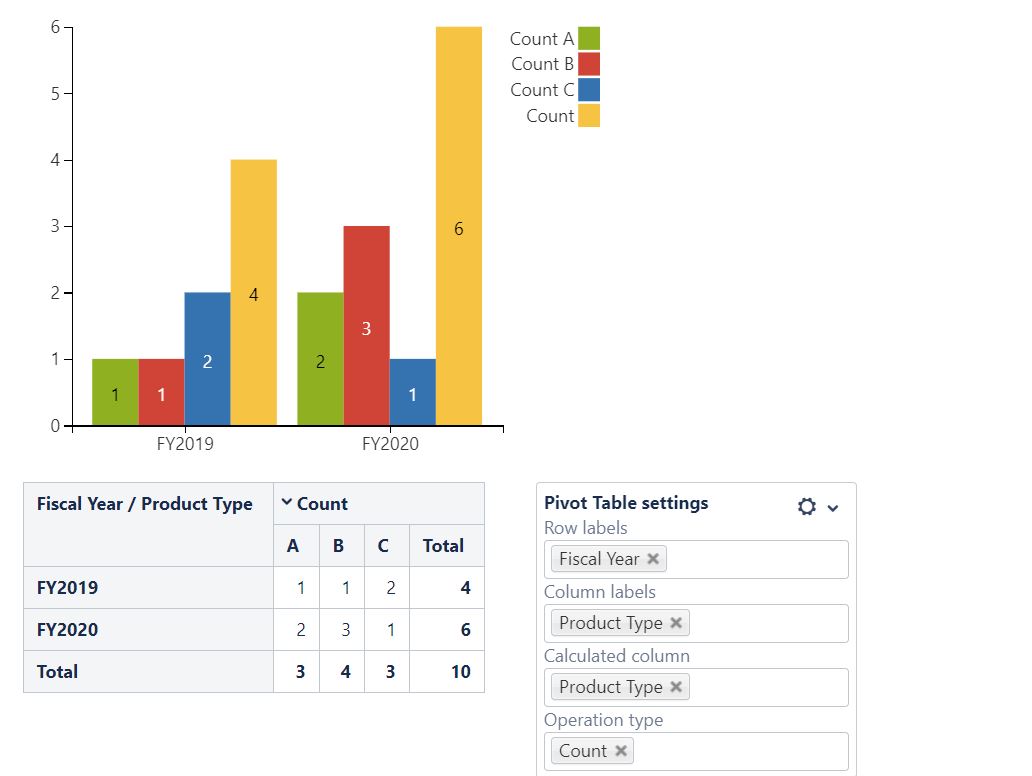
Below is my chart and pivot table generated from the table. As you can see product-A increased from 1 to 2 (100% increase) between FY2019 and FY2020. How do I get to show this change % in the chart ??? Similarly, Product-B has 50% decrease (2 to 1) between FY2019 and 2020. How to do I display that information in my chart and pivot table?