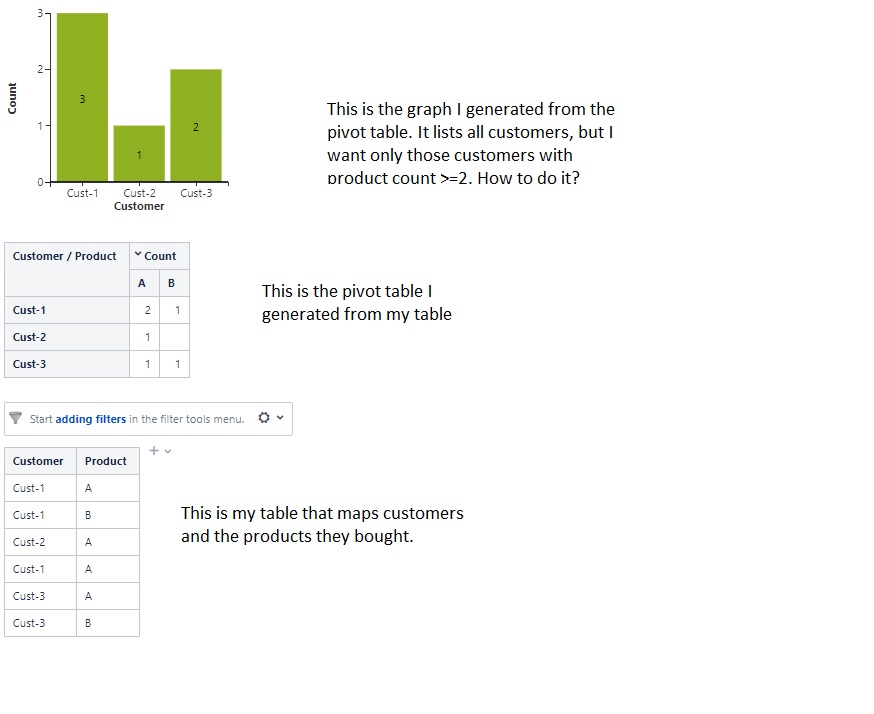
I have a table that maps customers and the products they bought. I've made a pivot table that gives me the total product count of each customer. Now I want to make a graph from that pivot table, but I would want only those customers who have product count >=2
Below is my graph and pivot table. As you can see, only Cust-1 and Cust-3 have product count >=2 and so, I only want those 2 customers to be listed in my graph. Cust-2 should not be displayed in the graph. How can I achieve this ???