Hi,
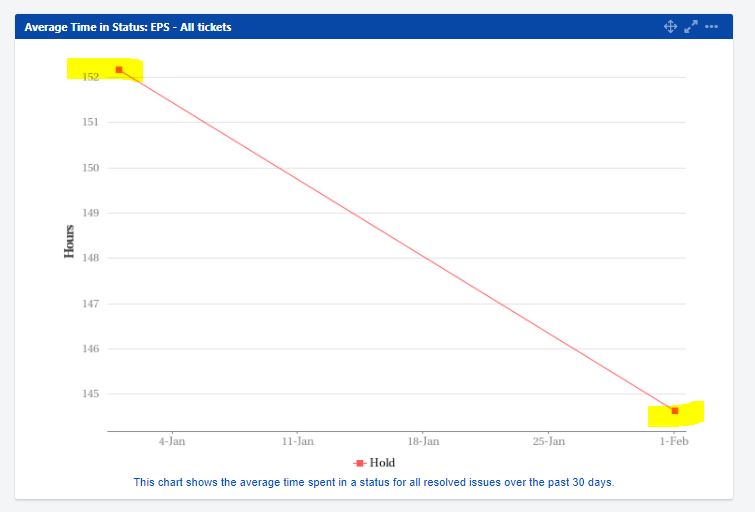
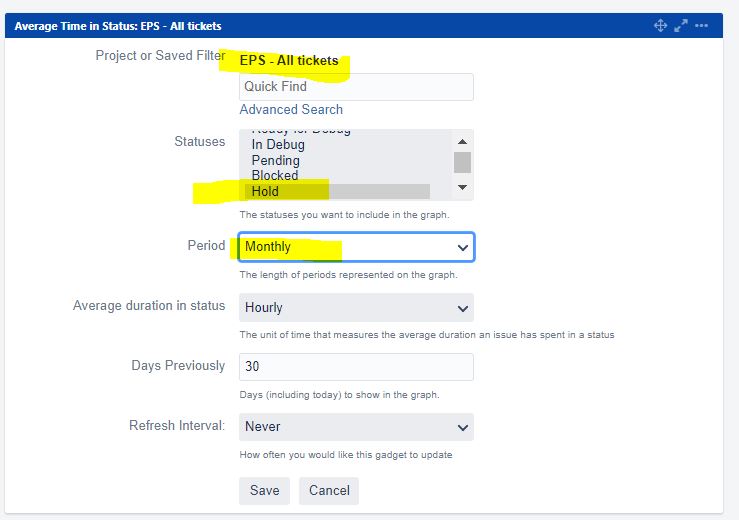
I'm looking to create a graph (if possible) from a filter. I need to display "on-hold" status tickets (average time per ticket).
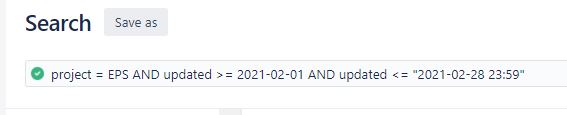
I created a filter for a particular jira project (all tickets) and then created a 'time to resolution' gadget but it just doesn't look right.
If I click on the orange points in the graph, it takes me to the tickets but quick browsing doesn't display 'on-hold' tickets. I'm sure I'm missing something.
Would greatly appreciate any ideas/suggestions.
~JV


![Photo of Emre Toptancı [OBSS]](https://us.v-cdn.net/6038660/uploads/avatars/88/25/n8825d1e863017fd80882ab56e7550387.png)


