JIRA version: 8.9.0
1763 users
Database SQL Server 2016
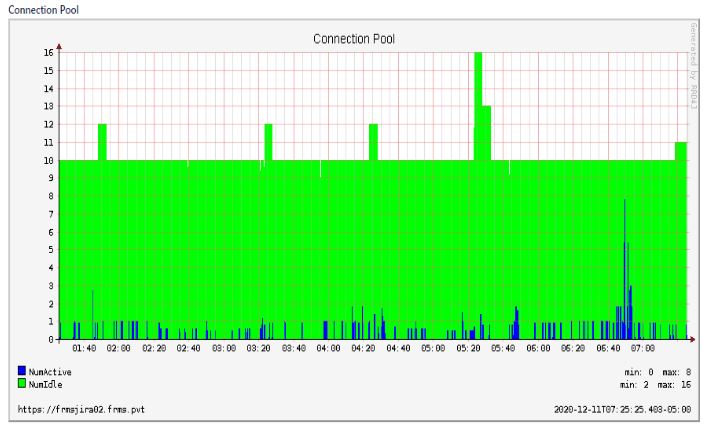
Our DataCenter installation of JIRA has 3 nodes running behind a load balancer. Each appear to have an equal share of the load, but while two nodes have low numbers of active connections, one has a high number of active connections which has a distincly upward trend:
 All of the nodes have identical dbconfig.xml files:
<jira-database-config>
<name>defaultDS</name>
<delegator-name>default</delegator-name>
<database-type>mssql</database-type>
<schema-name>dbo</schema-name>
<jdbc-datasource>
<url>jdbc:sqlserver://;serverName=XXXXXXXXXX;portNumber=1433;databaseName=EPS-JIRA</url>
<driver-class>com.microsoft.sqlserver.jdbc.SQLServerDriver</driver-class>
<username>xxxxxx</username>
<password>xxxxxx</password>
<pool-min-size>10</pool-min-size>
<pool-max-size>60</pool-max-size>
<pool-max-wait>30000</pool-max-wait>
<validation-query>select 1</validation-query>
<min-evictable-idle-time-millis>60000</min-evictable-idle-time-millis>
<time-between-eviction-runs-millis>300000</time-between-eviction-runs-millis>
<pool-max-idle>20</pool-max-idle>
<pool-remove-abandoned>true</pool-remove-abandoned>
<pool-remove-abandoned-timeout>300</pool-remove-abandoned-timeout>
<pool-test-on-borrow>false</pool-test-on-borrow>
<pool-test-while-idle>true</pool-test-while-idle>
</jdbc-datasource>
</jira-database-config>
I cannot find any differences in any other configuration between the nodes so I am at a loss as to why there is this marked difference.
For reference, this is the monitoring on another node for the same time period:
Does anyone have an suggestions?

