Hi,
I have a space and a page properties table on each page with key details. One of these page properties is 'IT Area'. I'm trying to insert a chart into its own page that is using a filtered table based on 'ITArea' to show me how many project has per 'IT Area' but it's just not working!
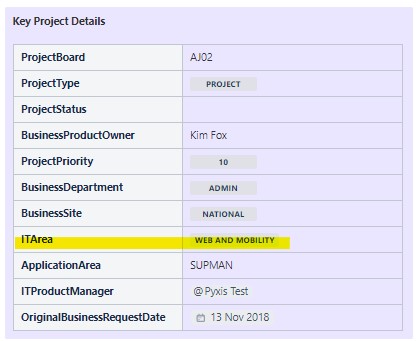
This is my page properties table with the key property highlighted:
This is my page where i want the chart to sit. The report at the bottom is a replica of the page properties report that is sitting in the chart macro, filtered on ITArea:
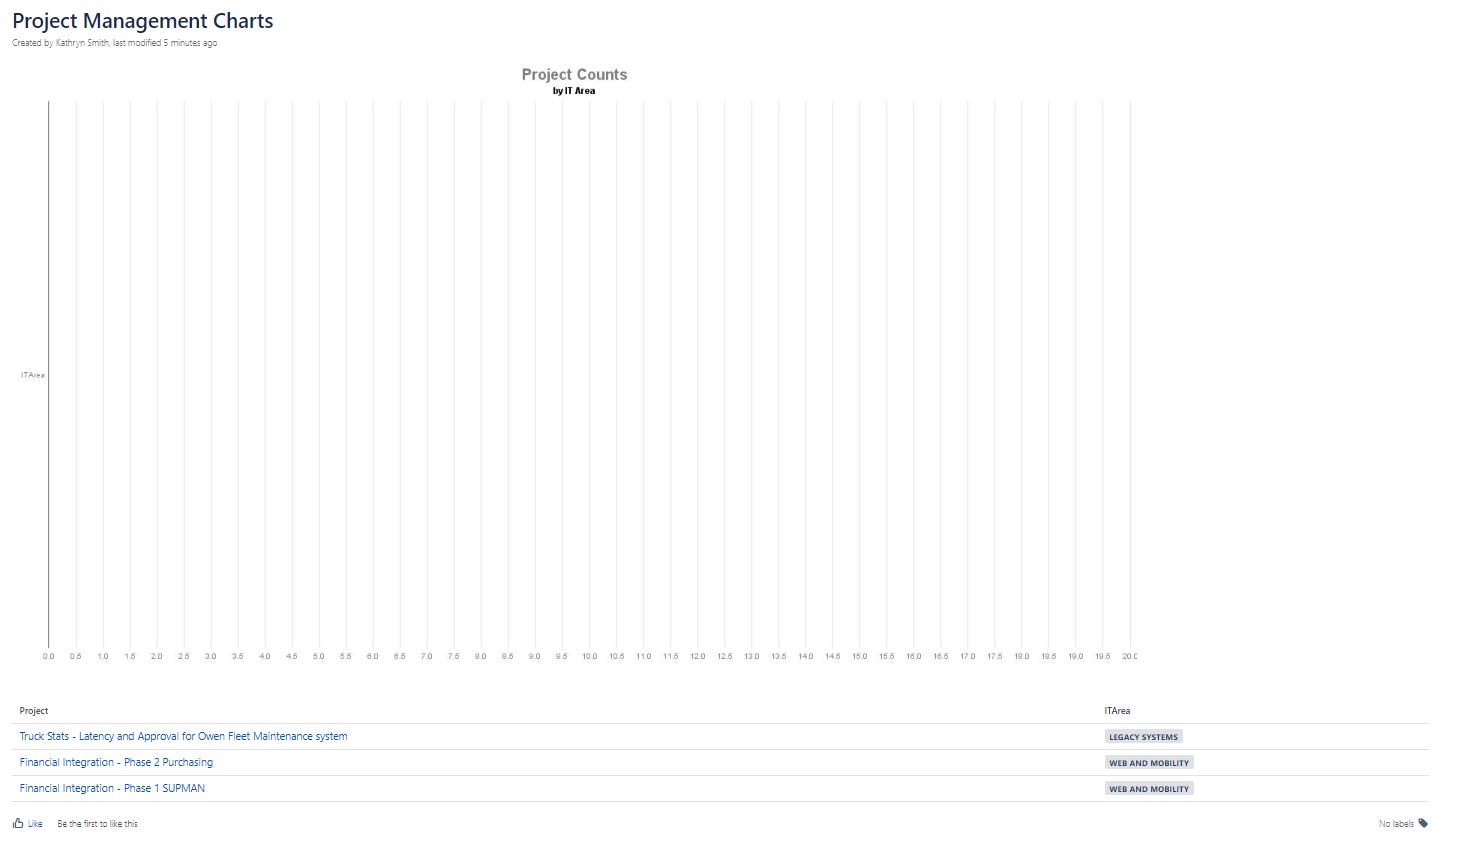
The chart is not showing any data even though there are 3 projects in two different IT Areas.
Any ideas - also not open tp paid add-ons if i can help it.
Thanks
Kat


