Hi
There is a periodic slowdown during operation.
I checked realted logs. This logs are continuously output.
2019-05-29 11:16:38,517 WARN [alert-dispatch:thread-1] [confluence.alert-log] log 1559096198513 ; WARNING ; JVM ; JVM-1002 ; Garbage collection exceeded time limit ; not-detected ;  ;  ; {"durationInMillis":10222,"windowInMillis":20000,"limitPercent":10,"threadMemoryAllocations":"","threadDump":[]}
2019-05-29 11:16:38,520 WARN [alert-dispatch:thread-1] [atlassian-monitor] log 2019-05-29T02:16:38.513Z Component 'Java' alerted 'Garbage collection exceeded time limit' (details: {"durationInMillis":10222,"windowInMillis":20000,"limitPercent":10,"threadMemoryAllocations":"","threadDump":[]}, trigger: {"pluginKey": "not-detected"})
Restarting Confluence is fine for a while(about 2 weeks).
Our Confluence Server Version is 6.13.4.
We use Bitbucket, Confluence and Jira on one server. (100 user license)
- Real user is about 60.
- Server Memory : 32G
I thik the suspicious part is as follows
- Configuration
- Server.xml
- confluence.cfg.xml
- hibernate.c3p0.max_size : 125
- Backup
- We perform the backup at dawn. Looking at the results of the monitoring, it seems that memory is being used at the maximum.
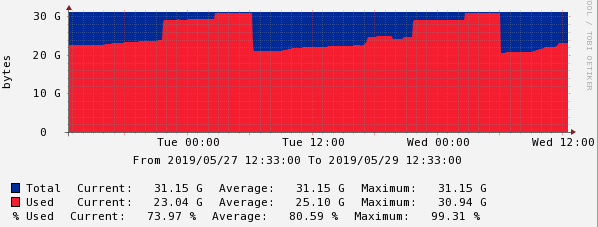
How can we solve this problem?
Thank you for your help.


