Hi,
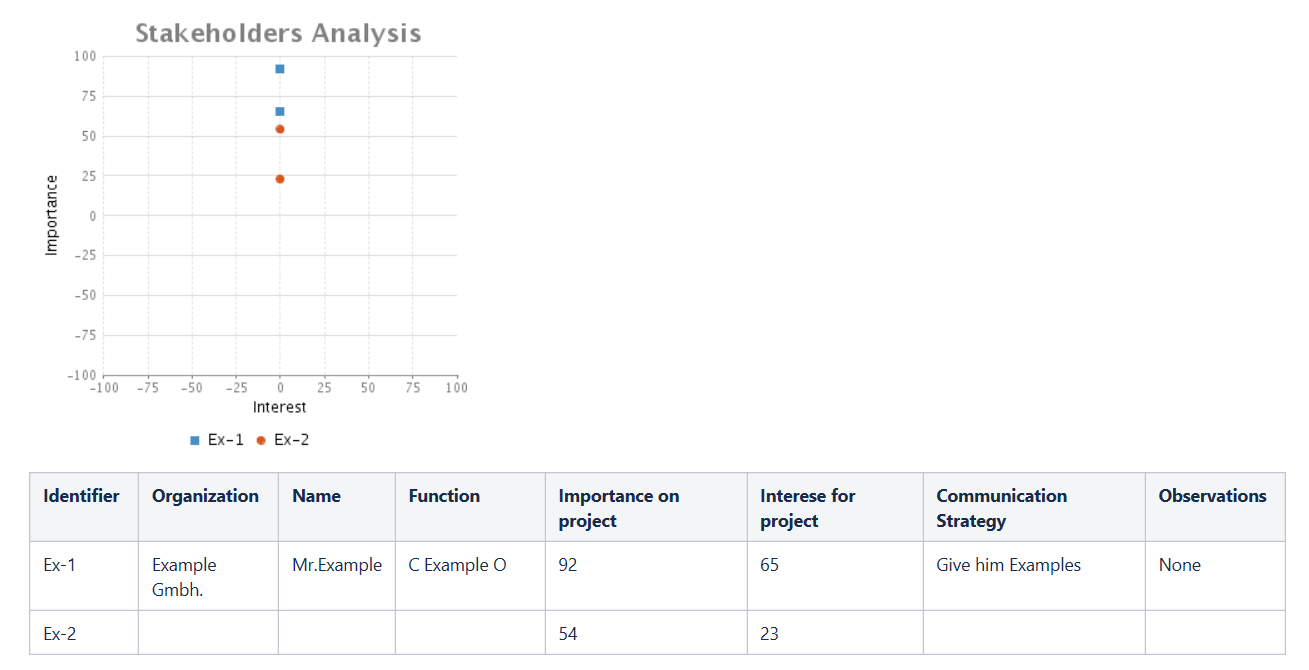
Im trying to create a scatter chart, but the {chart macro will not recognize values in different columns as X and Y, and plots the values in the same axis.
Unless i substitute the cell that says "Importance on project" with a X value, but this would force me to recreate the chart in table form essentially, is there ANY way to just say x=n; y=n1?