Hello All,
We are looking for the release burn down chart based on feature.Currently we have release burn down chart based on the story points.
Attached chart is showing the chart based on the story points completed till date similarly can we have similar graph for entire release features(features will have user stories and tasks).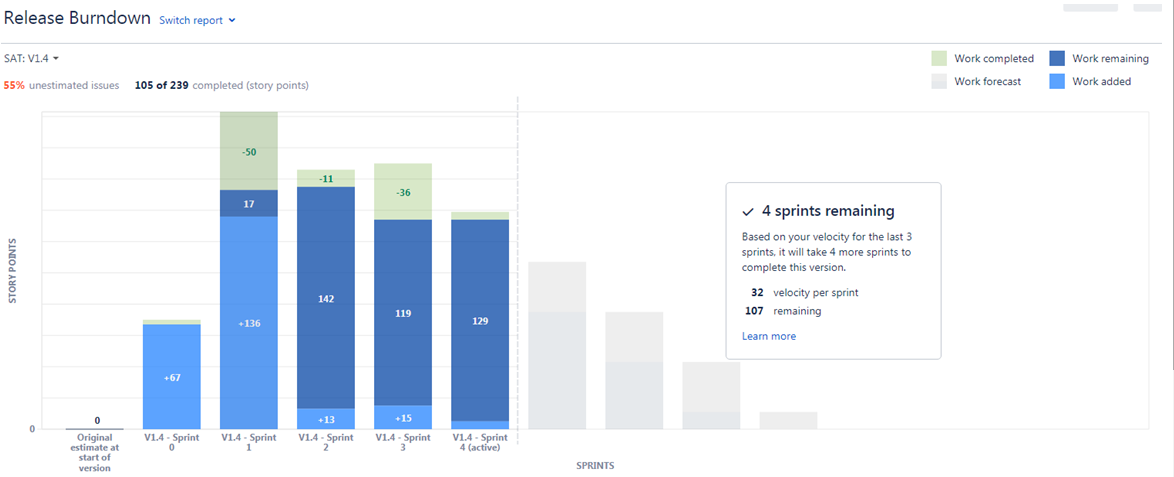
For e.g.: If there are 10 Features for the release can we create bar chart which shows the progress of the features till date .

