Velocity vs throughput is a common question for Jira teams. Both metrics describe delivery, but they answer different questions.
Velocity is the amount of estimated work a team completes in a sprint. Scrum teams usually express it in story points, although they can use time estimates or another consistent estimation unit. Velocity is most useful when the same team estimates in a stable way and works in regular sprints.
Throughput is the number of work items completed during a defined period. That period might be a sprint, week, or month. Throughput does not require estimates, so it works well for Kanban, service, support, and other continuous-flow teams.
|
|
Velocity
|
Throughput
|
|
Measures
|
Estimated work completed
|
Work items completed
|
|
Typical unit
|
Story points or time
|
Item count
|
|
Typical period
|
Sprint
|
Week, month, or another interval
|
|
Best use
|
Planning the next sprint
|
Understanding delivery rate and flow
|
Which metric fits your team?
Imagine two teams working in the same Jira instance. One is a Scrum product team that estimates work in story points. The other handles a steady stream of service requests that arrive without warning.
Both teams want to understand delivery, but they need different answers. The Scrum team asks, “How much estimated work can we plan for the next sprint?” The service team asks, “How many requests do we finish each week, and where does work slow down?”
That difference matters. Velocity and throughput can both be useful, but neither is automatically the better metric. The useful metric is the one that supports the team’s next decision.
The choice becomes easier when you connect the metric to a real delivery question. These examples show how different Jira teams can use velocity, throughput, or both without turning either number into a productivity score.
|
Team
|
Delivery question
|
Useful metric
|
Add context with
|
|
Scrum product team
|
What can we reasonably plan for the next sprint?
|
Velocity as the primary signal; item-count throughput as support
|
Scope change, completion percentage, and cycle time
|
|
IT service team
|
How many requests do we resolve, and is the rate stable?
|
Weekly item throughput
|
Work in progress, time in status, and reopened work
|
|
Kanban development team
|
How much work moves to Done when item sizes vary?
|
Item throughput plus story points completed per period
|
Cycle time, WIP, item type, and size
|
|
Multi-team release
|
Is the shared release scope moving toward completion?
|
Release-level throughput or completed scope; keep team velocities separate
|
Remaining scope, blockers, and forecast
|
What can you track with native Jira?
Velocity with the native Velocity Chart
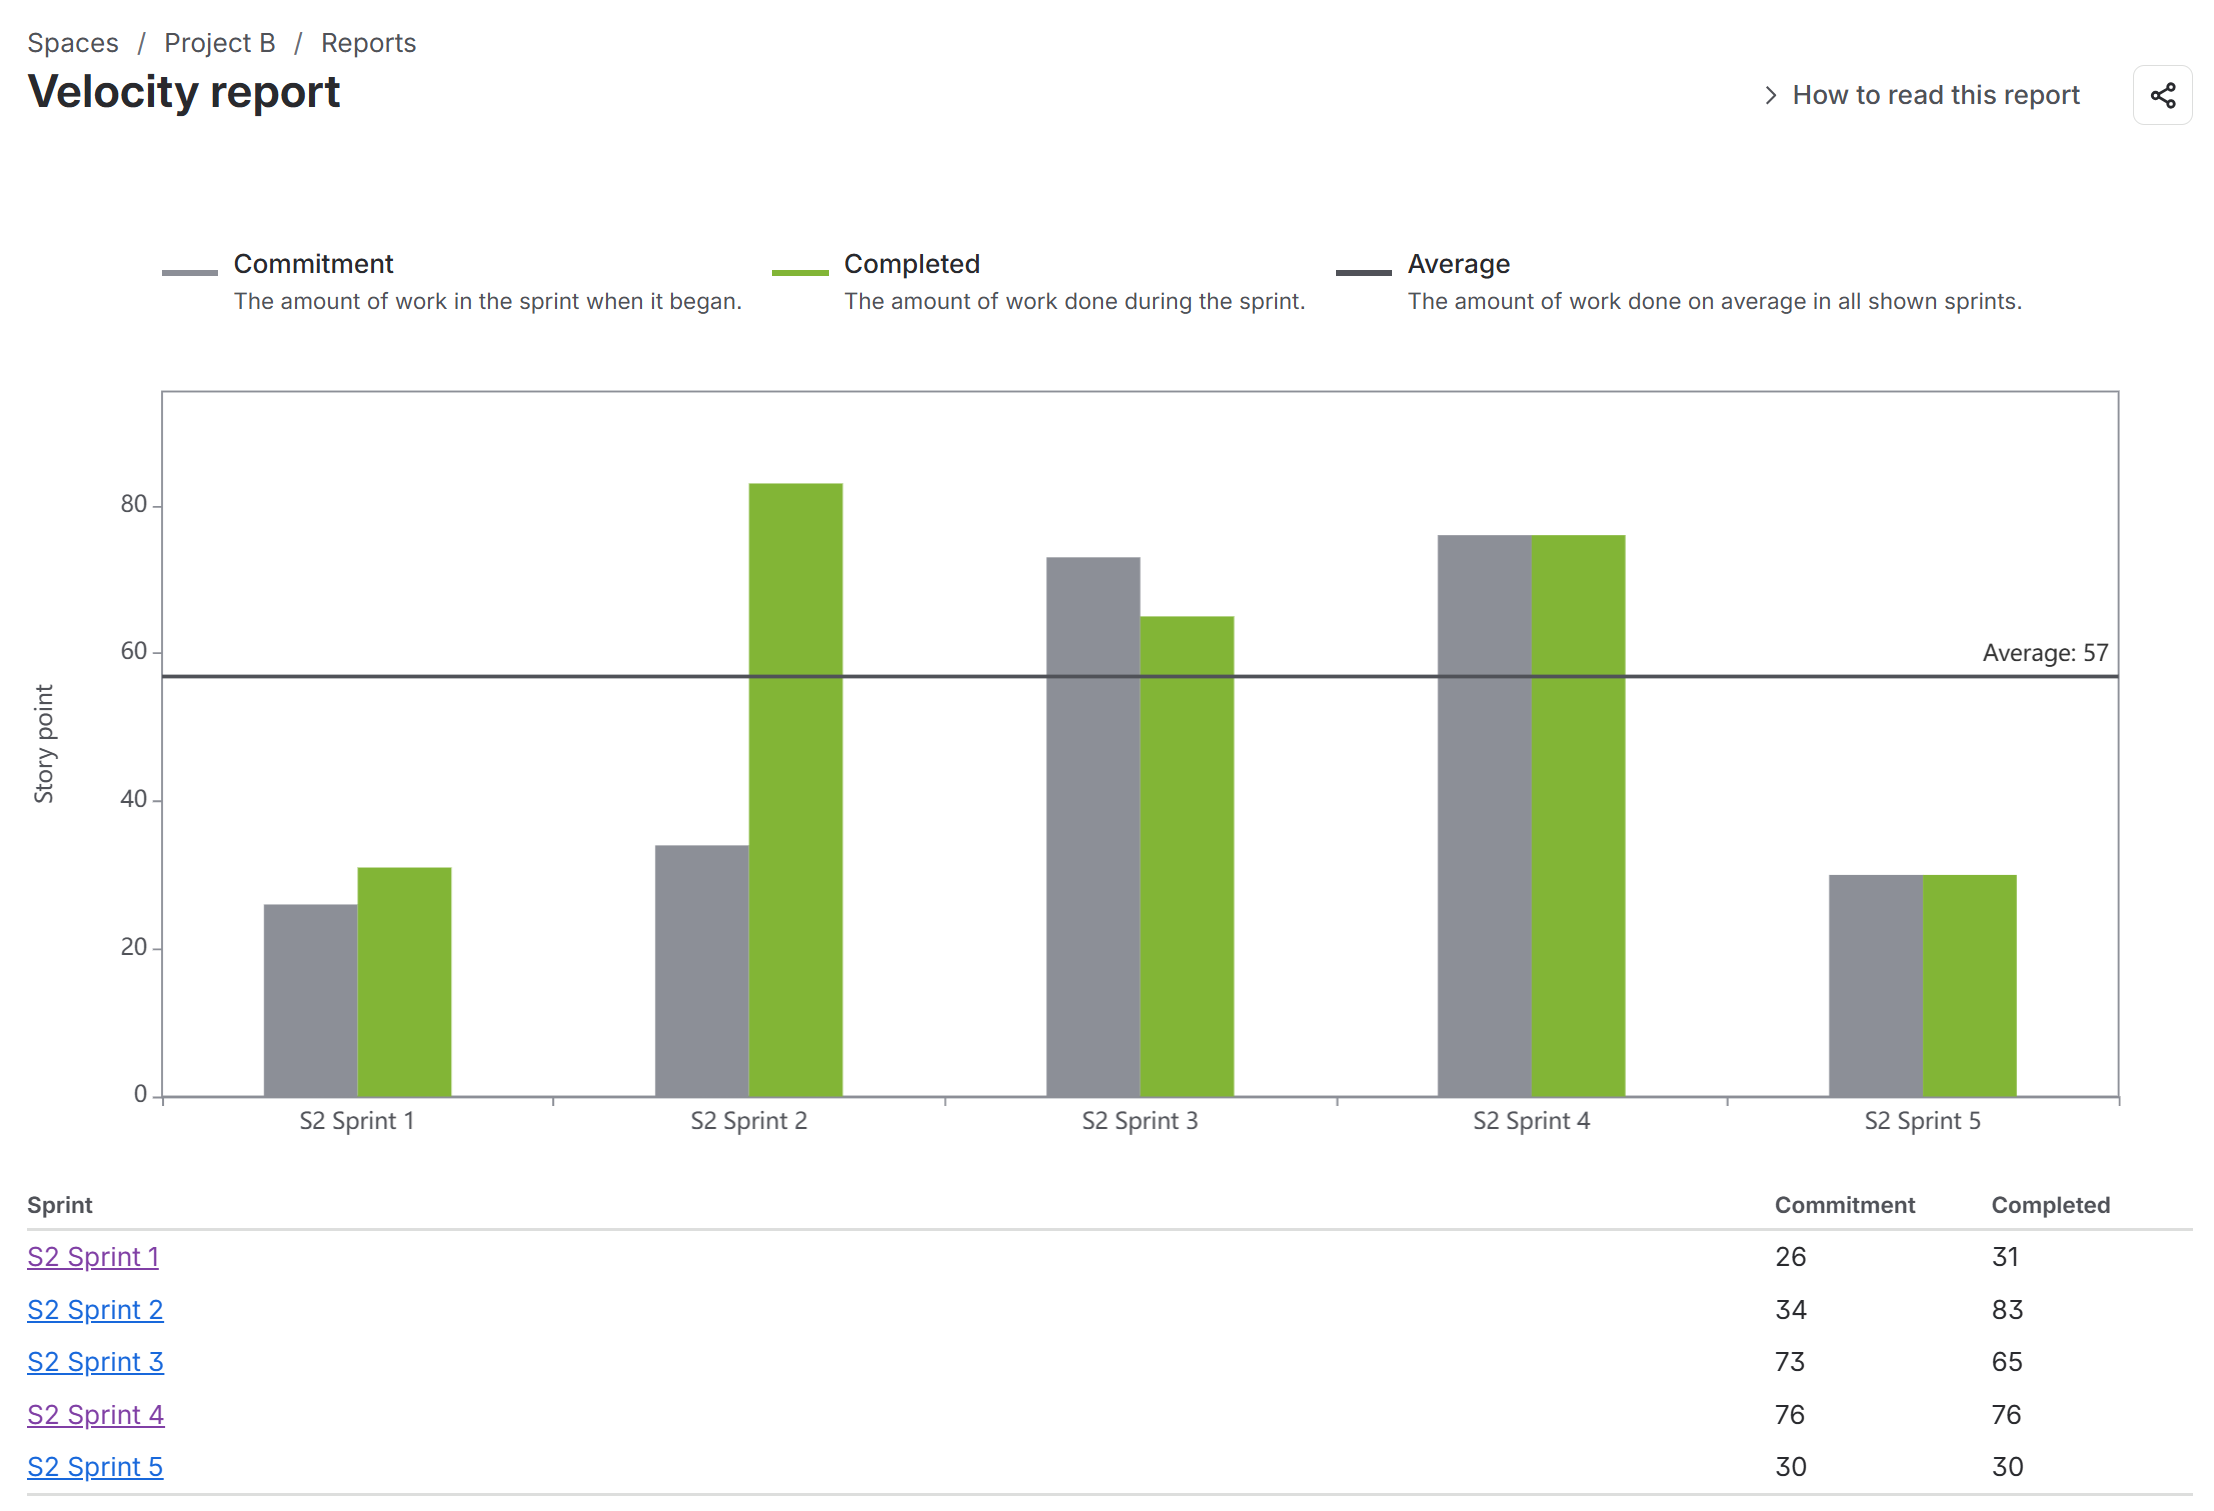
For a Scrum project, Jira’s native Velocity Chart Report is the natural place to start. It compares the work committed at the beginning of each sprint with the work completed by the end. Depending on the board configuration, the estimation statistic can be story points, original time estimates, Work Item Count, or another numeric field.
When the team uses story points, the Completed value is its velocity for that sprint. The chart also shows an average based on the displayed sprint history. This gives a stable Scrum team a useful reference when discussing how much estimated work to plan next.
Velocity Chart Report limitations
The native report offers a fixed view, it shows only a limited number of most recent completed sprints and does not include the active sprint. You cannot choose a longer history or filter sprints by name or completion date. Jira also shows one overall average instead of a rolling average.
The report is tied to one board and excludes subtask estimates. It counts an item as Done only when its status is mapped to the board’s far-right column. Because this is a report rather than a standard dashboard gadget, you cannot place it beside other metrics on a Jira dashboard.
Throughput with native Jira
For teams working in continuous flow, Jira offers other useful signals. A completed-work filter can return the items resolved during a chosen period. Created vs Resolved shows whether completed work is keeping up with incoming work, while the Cumulative Flow Diagram helps reveal work in progress, growing queues, and bottlenecks.
However, Jira does not provide the same dedicated, configurable per-period throughput chart for Kanban work.
More customizable velocity and throughput charts with Great Gadgets
Native Jira reports are a good starting point for one team using a standard board setup. More flexibility becomes useful when you need the metrics on a shared dashboard, want to include the current sprint, need custom Done statuses, or want to choose the time periods and averaging method.
This is where Great Gadgets can help. Its gadgets extend the native options rather than changing what velocity and throughput mean. For transparency, Great Gadgets is the Jira reporting & dashboarding app we develop at StonikByte.
📊 How to track team velocity in Jira dashboards
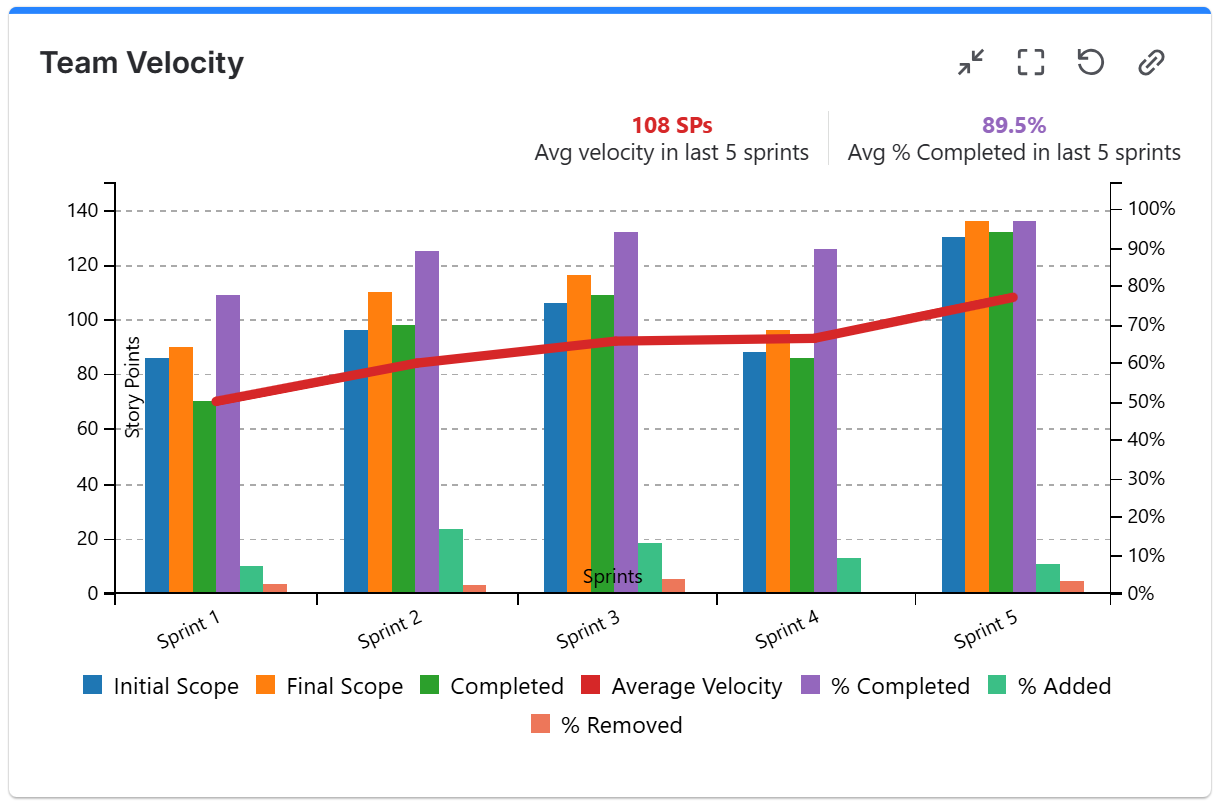
The Team Velocity gadget offered by Great Gadgets displays the average velocity of a Scrum team together with its sprint history. It can include the active sprint, display a chosen number of sprints, filter by sprint name or completion date, and calculate a rolling average.
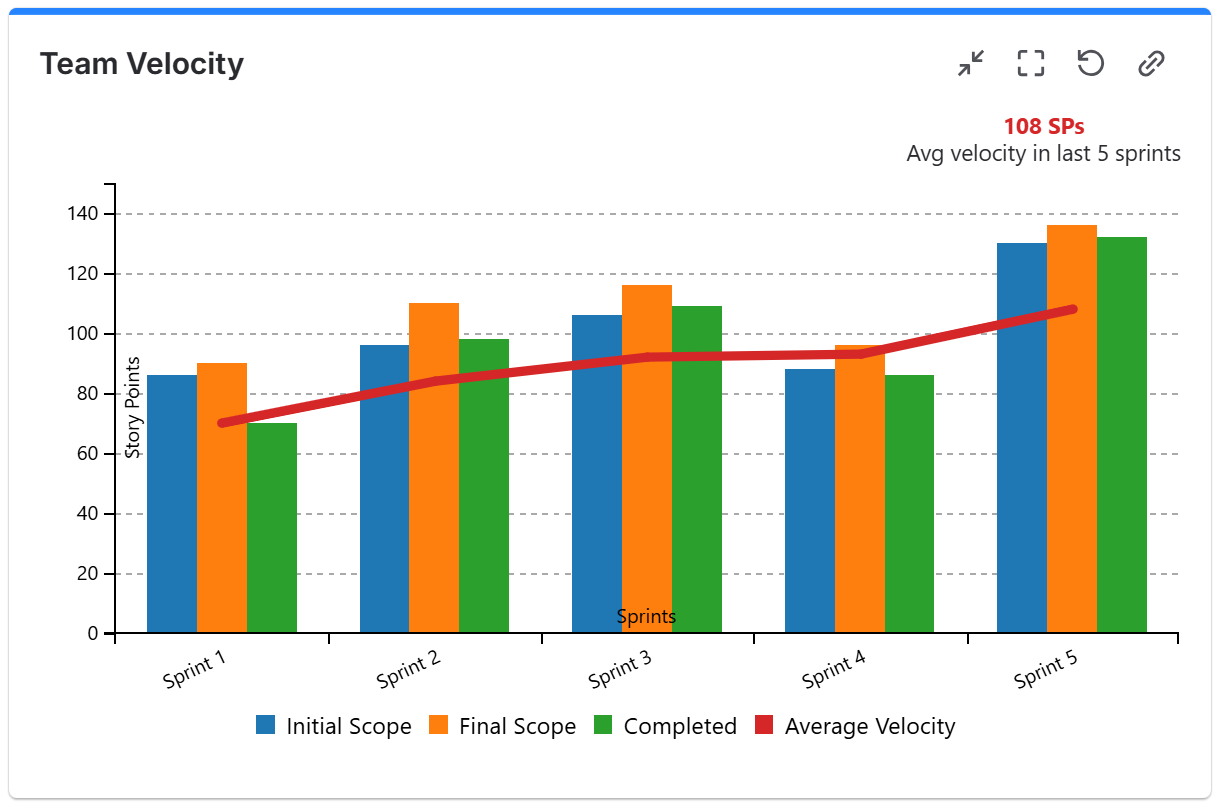
It also supports subtasks, custom Done statuses, and metrics such as scope change, work added or removed, % completed, % added, and % removed.
📈 How to track throughput in Jira dashboards
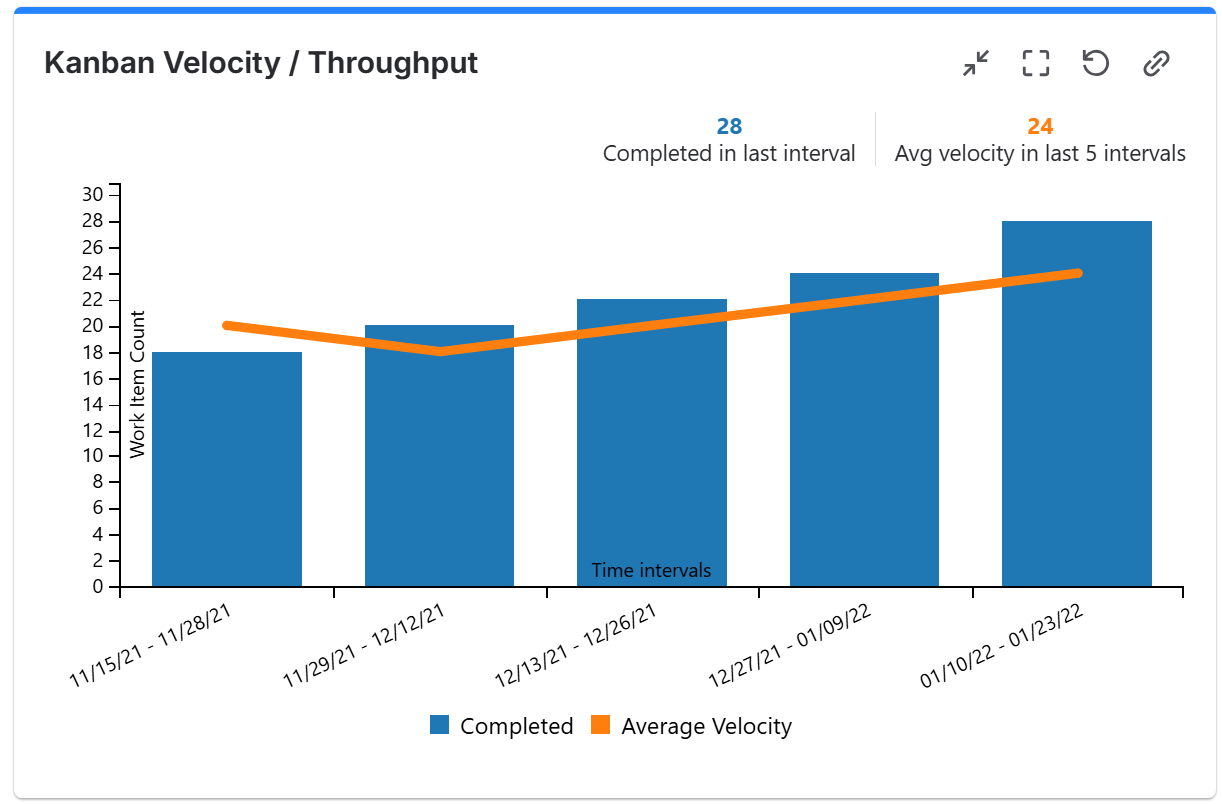
The Kanban Velocity/Throughput gadget tracks completed work across past time intervals. For standard throughput, configure it to calculate by Work Item Count. It can also calculate by story points, time estimates, or a numeric custom field across configurable intervals. Pairing it with WIP, cycle time, and Time in Status helps explain why the delivery rate changed instead of showing the number alone.
But what if your team needs to measure throughput based on story points?
Throughput based on story points is a valid option when work items differ greatly in size or complexity. It answers “How many estimated points did we complete during this interval?” instead of “How many items did we complete?”.
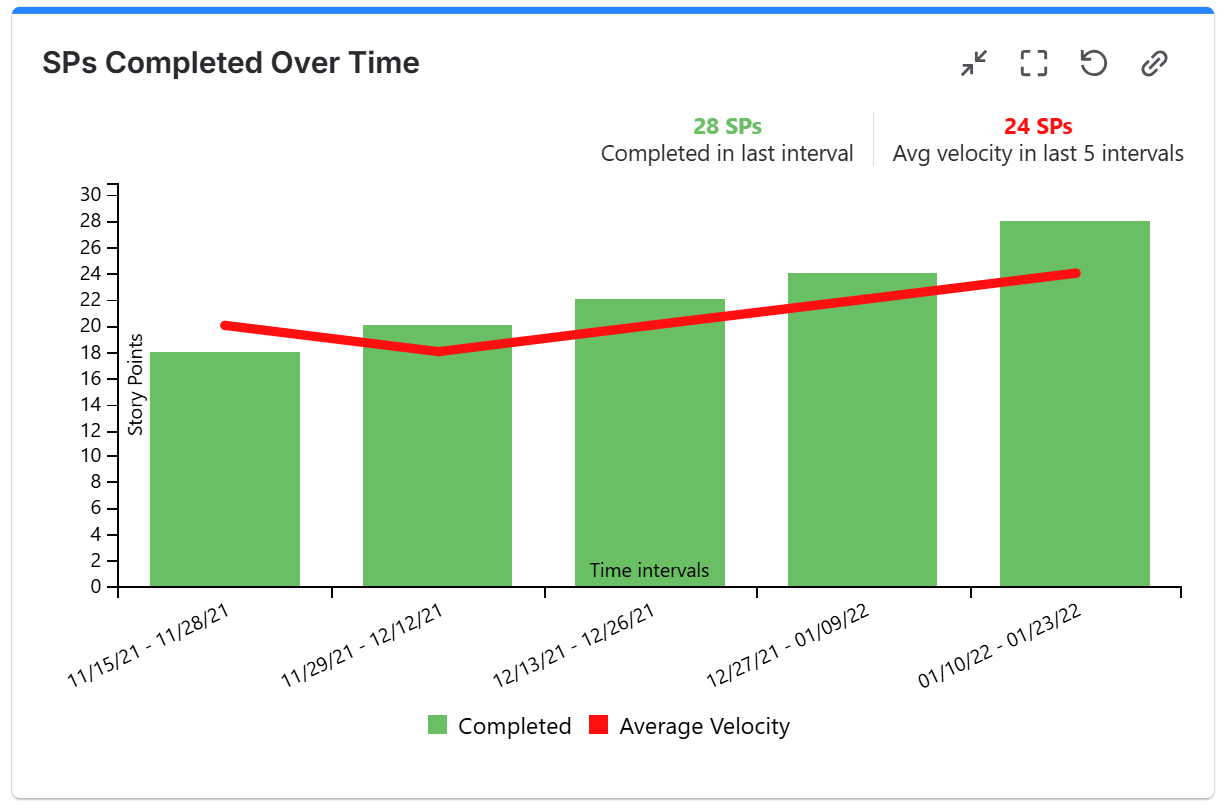
With the Kanban Velocity / Throughput gadget you can easily calculate how many story points your team completes during a time period. Label the chart clearly, and keep item-count throughput nearby when you also want to understand flow volume.
You can explore the configuration options in the Team Velocity and Kanban Velocity/Throughput documentation.
Want the complete walk-through? We cover more of this in our latest Velocity vs. Throughput blog article.
Final thoughts
Velocity and throughput are not competing versions of the same metric. Velocity helps a Scrum team plan estimated work across sprints. Throughput shows how many items a team or process completes during a consistent period. Many teams benefit from viewing both, as long as each chart has a clear purpose.
Start with the native Jira report when it answers your question. If you need more control over the interval, sprint history, Done statuses, calculations, or dashboard layout, you can explore Great Gadgets with a free 30-day trial.
Great Gadgets for Jira is an all-in-one reporting and dashboarding suite for tracking projects of any kind and scale—from Scrum and Kanban delivery to ITSM, SAFe, and cross-team initiatives. Its configurable gadgets bring progress, flow, workload, delivery, and forecasting metrics into real-time Jira dashboards, helping teams understand where work stands and where it is heading.
![Photo of Danut M [StonikByte]](https://us.v-cdn.net/6038660/uploads/avatars/61/36/n6136735a8dac634c9907e07bddafeaa8.png)
