Hi, community!
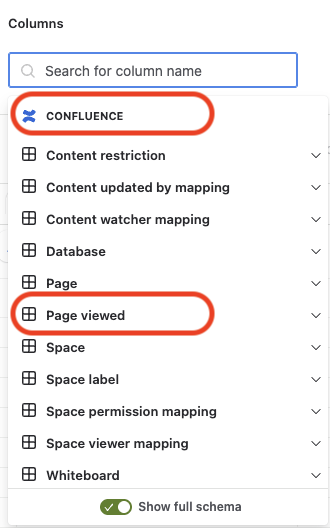
Event data for views of Confluence pages and blog posts is available in Analytics through the new Page viewed table. You’ll find it under the Confluence category in the schema browser.
Key columns explained
There are 3 default foreign key in this table: “Account ID”, “Space ID”, “Page ID”. They’re used to join this table to the “Account”, “Space”, and “Page” tables, respectively. Make sure to double-check your join path in Visual SQL.
🎥 Check out our video example
In this video, I’ll walk through how to show the most-viewed Confluence pages or blog posts from different spaces into one chart.
⚠️ Important caveats to keep in mind
-
Data duration: The “Page viewed” table retains data for a rolling period of 1.5 years (548 days). This allows for any year-over-year comparisons, but you’ll need to use a rolling window for your dashboard filters.
-
Limited data recoverability: Unlike the rest of Analytics app data, this data doesn’t have full disaster recoverability capability yet. Meaning in the case of a data disaster, not all record can be guaranteed a full recovery. (Note: this is a rare case, since Analytics app was born, a data disaster has never happened)
Why are these caveats? Page view data is considered app analytics (refer to the data residency glossary for the full definition). This data is generated and stored differently. This is the first time we’re making this type of data available in Analytics, so we’d like to hear your feedback on how we can improve it further.
How to get the new table
For new Data Lake connections that include Confluence data, this new table will automatically be available.
For existing Data Lake connections, an organization admin needs to edit the connections. If the connection already includes Confluence data, the organization admin can edit the connection and save it without making any changes. More about editing Data Lake connections.
Tell us what you think
Comment below or contact support if you have any questions or concerns. Thanks!
