|
Template Name
|
What It Is
|
How to Use It
|
Why It Works
|
Example
|
|---|
|
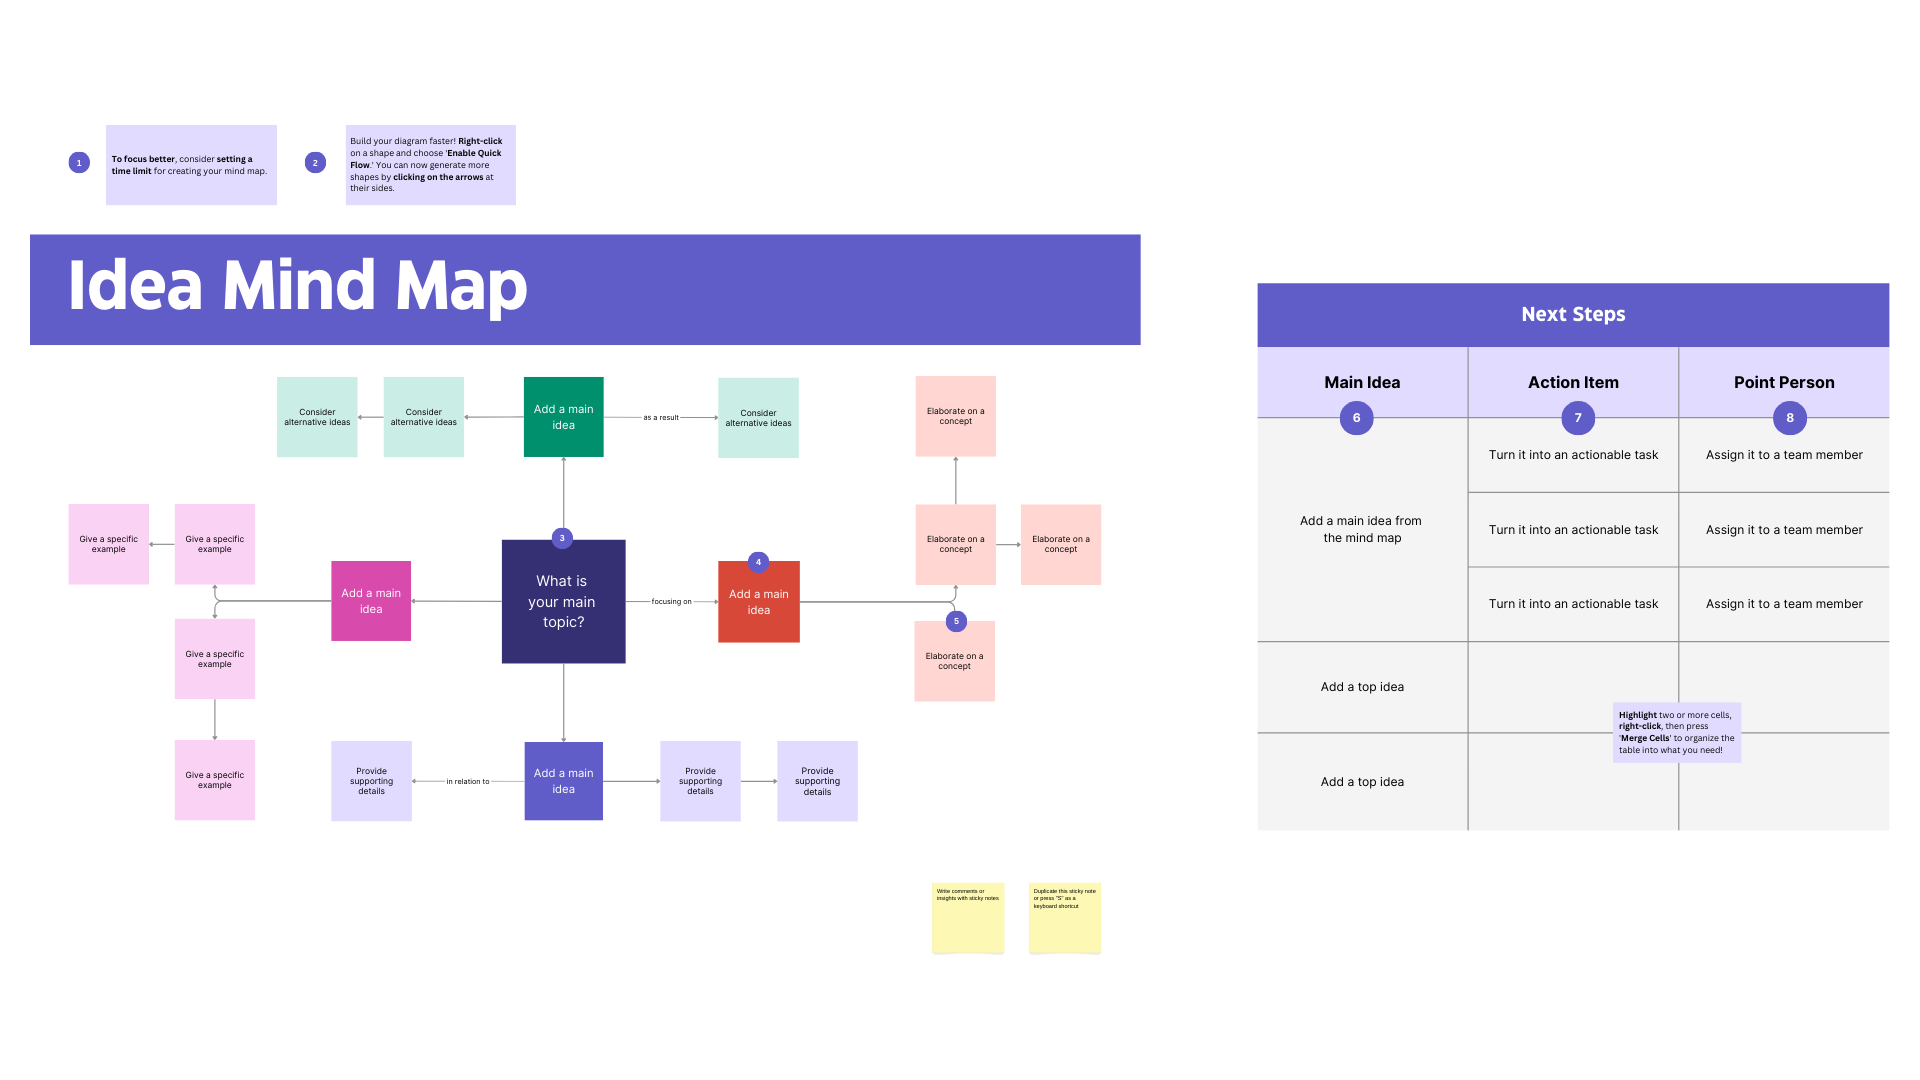
Idea Mind Map
|
A central-topic brainstorming tool that visually branches out main ideas.
|
Start with the main question or theme, then build branches with related ideas, examples, and alternatives.
|
Helps teams quickly organize and expand ideas in a structured way, revealing opportunities and connections.
|
|
|
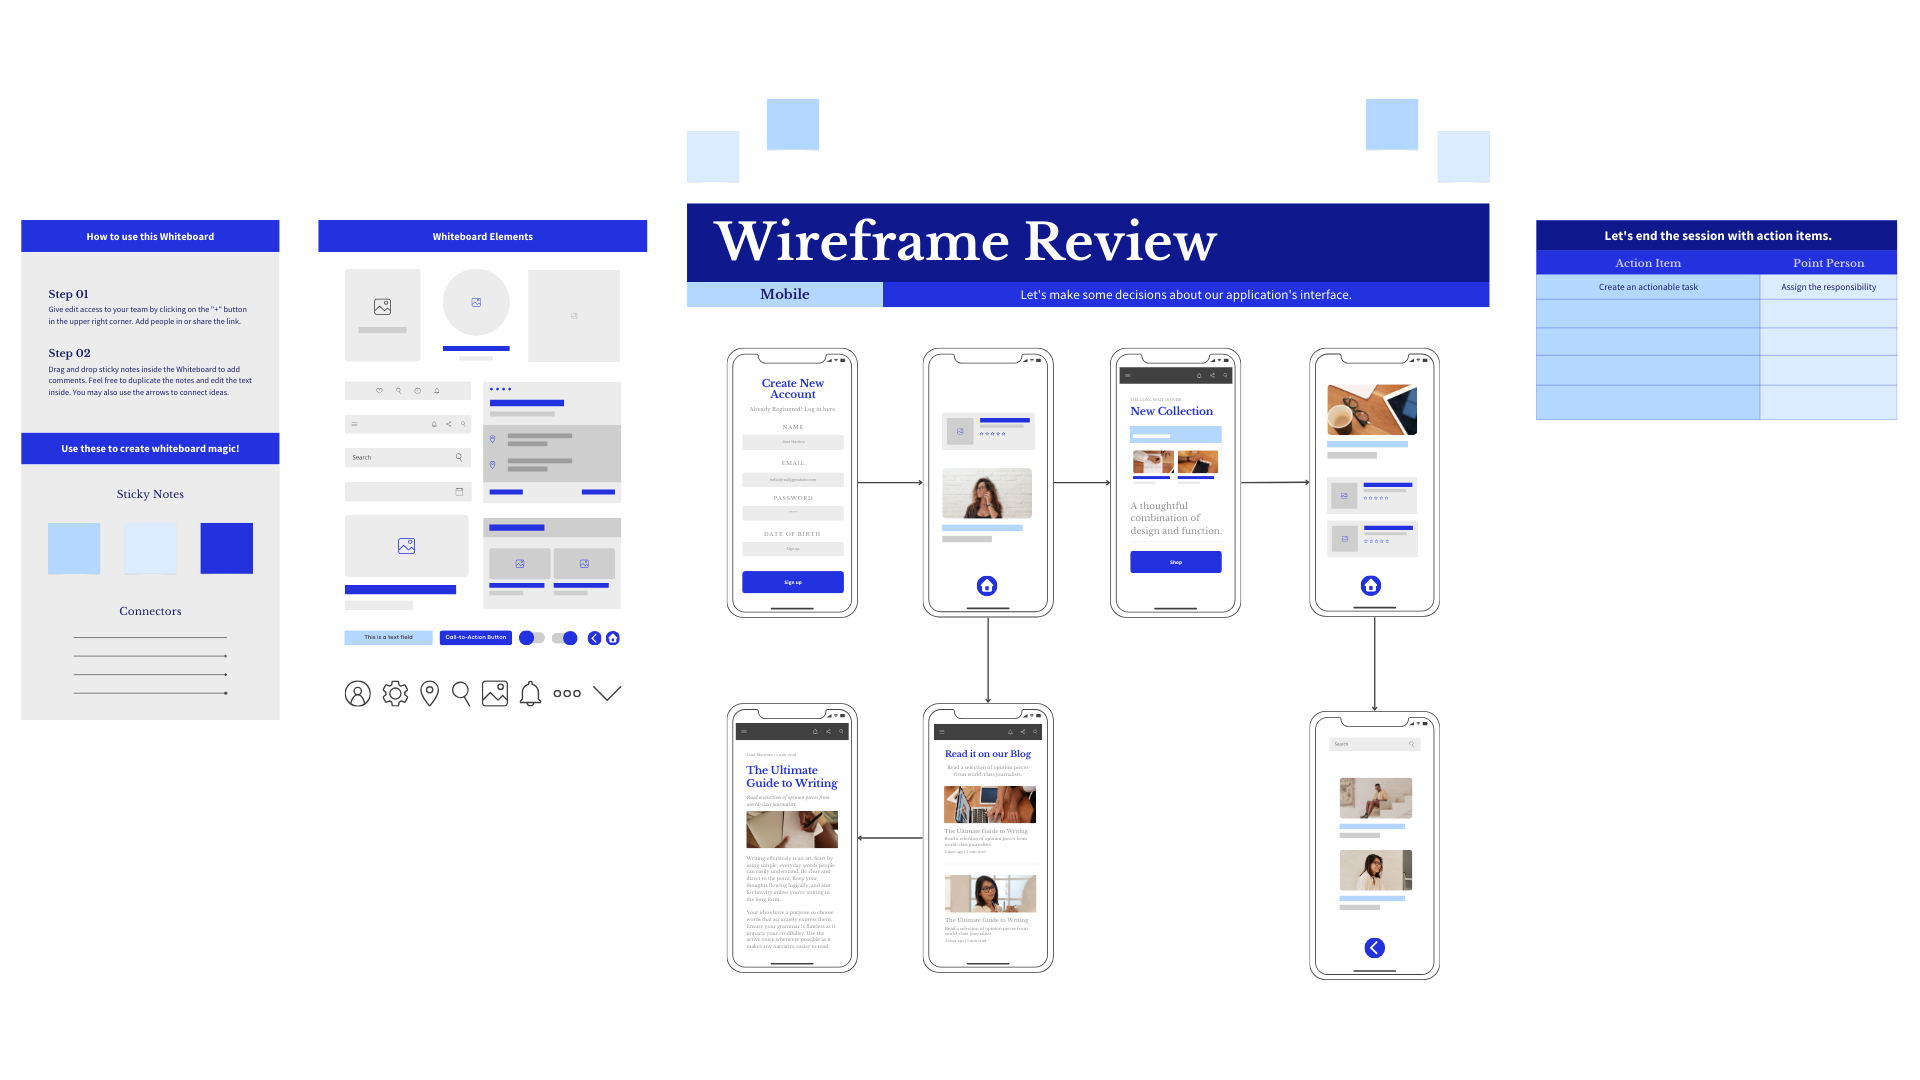
Wireframe Review
|
A mobile app wireframe walkthrough for UX/UI feedback.
|
Add wireframes to the flow, then use sticky notes and connectors to capture comments and navigation logic.
|
Aligns design with function by surfacing gaps and gathering input from non-designers in a visual way.
|
|
|
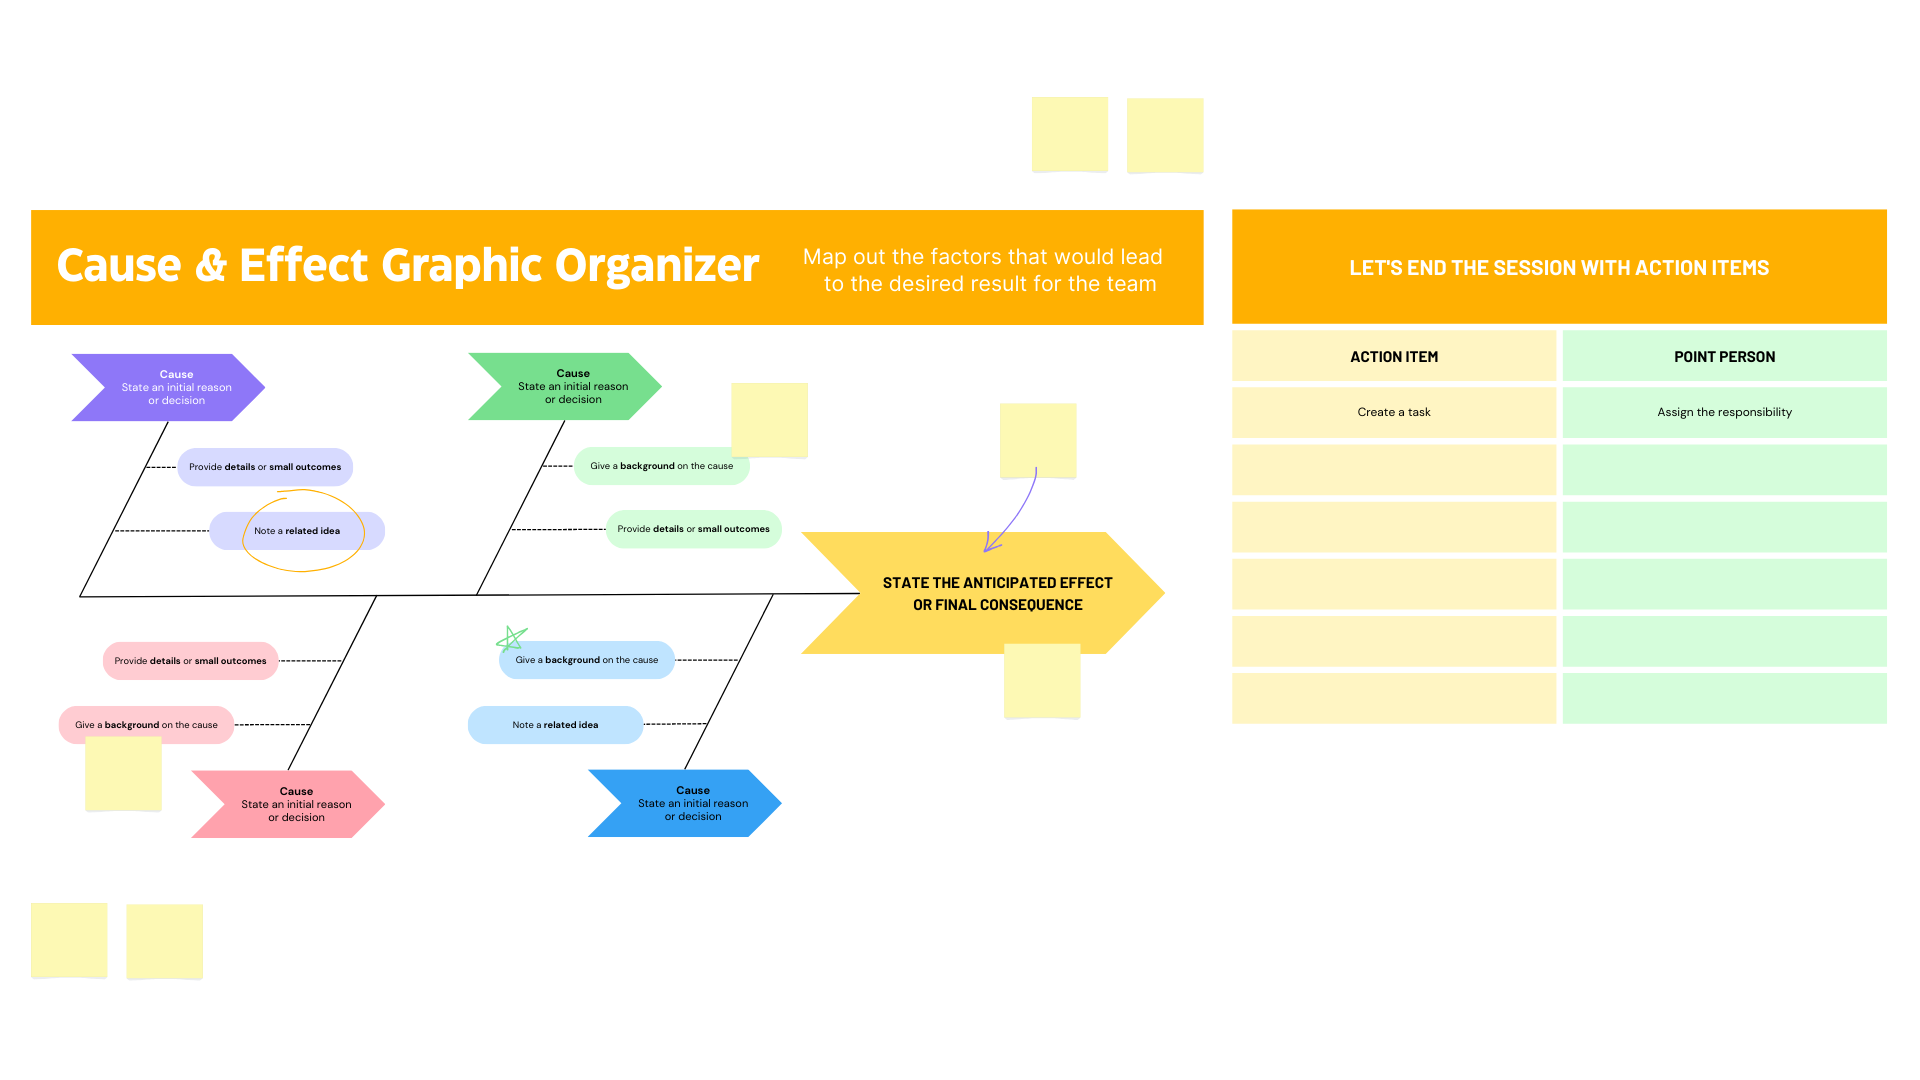
Cause & Effect Map
|
A visual breakdown of root causes leading to a specific outcome.
|
Identify a goal or outcome, then map out contributing causes and relevant background information in branches.
|
Encourages proactive thinking and systems analysis, revealing what’s influencing outcomes.
|
|
|
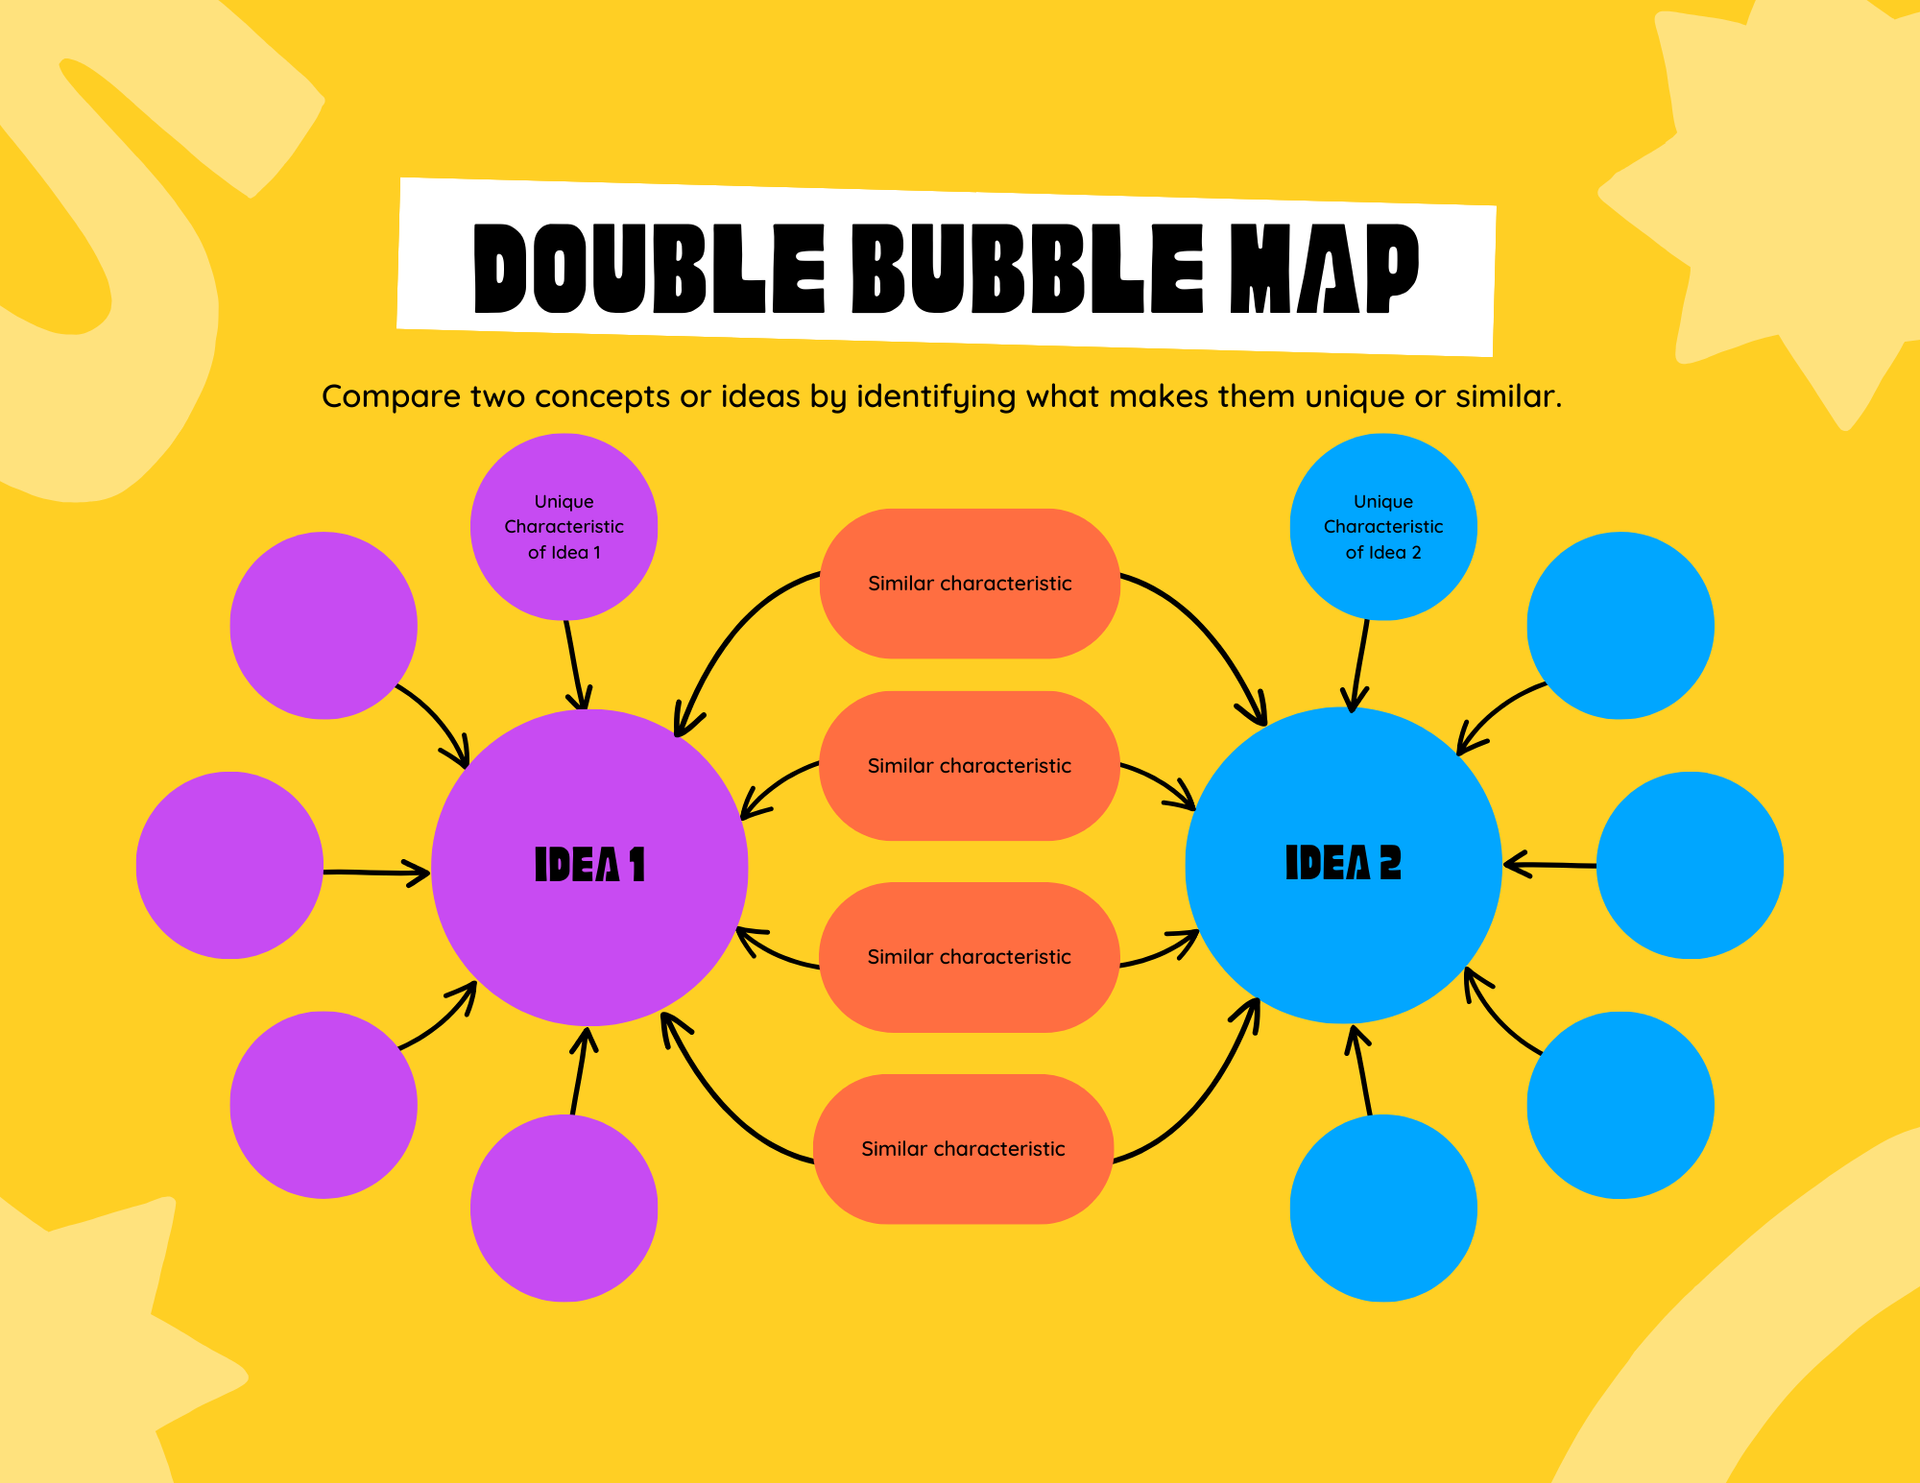
Double Bubble Map
|
A comparison tool to analyze similarities and differences between two ideas.
|
Place the two ideas in the center, then connect shared traits in the middle and unique traits on the outer edges.
|
Promotes critical thinking by clarifying both overlap and differentiation between concepts.
|
|
|
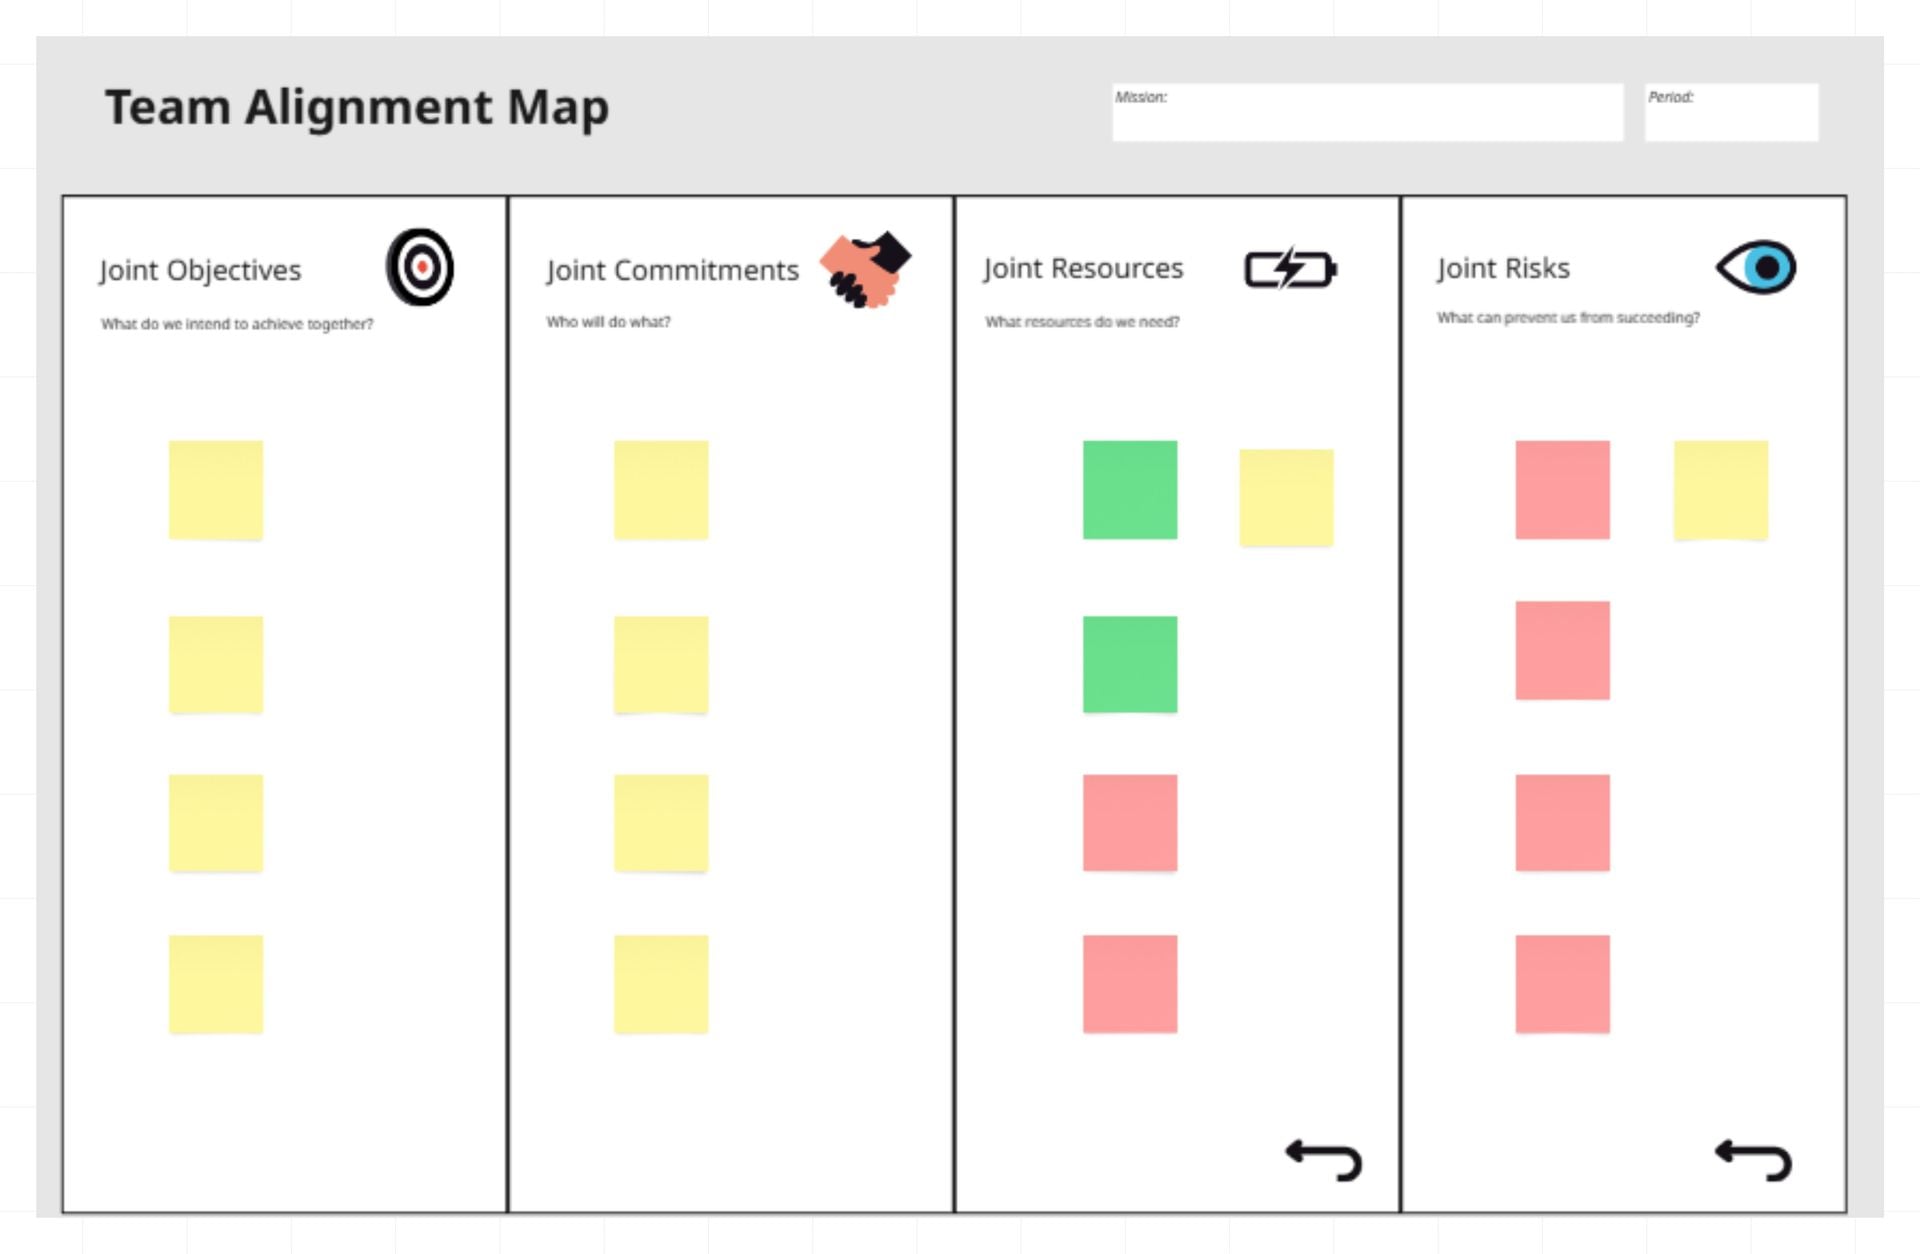
Team Alignment Map
|
A visual alignment tool to clarify team goals, roles, concerns, and resources.
|
Break the map into four quadrants: Goals, Roles, Challenges, and Needs. Have each team member add their input.
|
Surfaces misalignments early and creates a shared understanding of objectives and responsibilities.
|
|
|
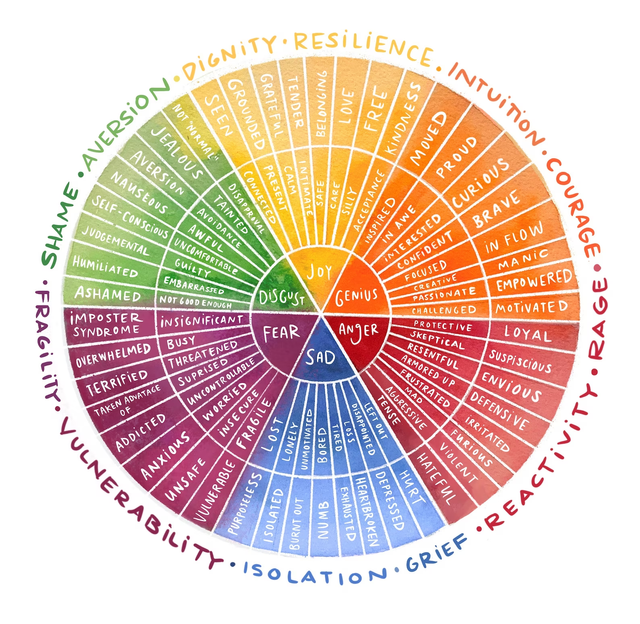
Emotion Wheel
|
A tool for emotional check-ins and discussions.
|
Invite team members to select and place stamp on the emotion(s) they’re feeling. Use a sticky note for reflection or 1:1s.
|
Builds psychological safety, improves communication, and supports emotional intelligence in teams.
|
|
|
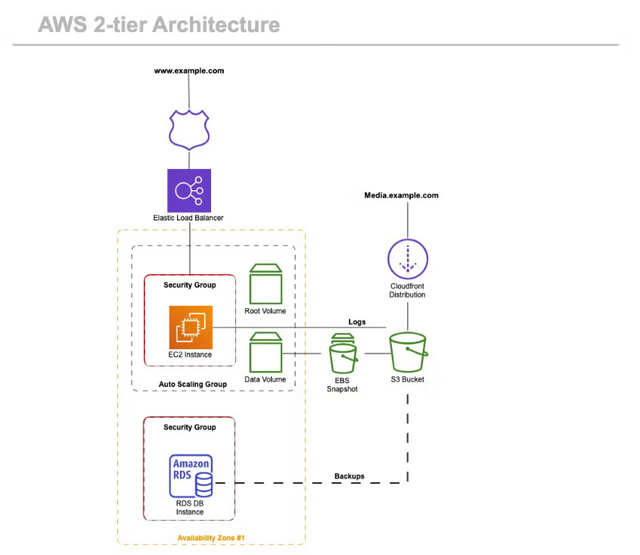
AWS 2-Tier Architecture
|
A system diagram for visualizing frontend/backend services and infrastructure.
|
Use stickers to label services (e.g., EC2, RDS, Load Balancer). Connect them using arrows and group zones with shapes.
|
Helps non-technical stakeholders grasp infrastructure design, while enabling tech teams to align and iterate quickly.
|
|


