In Atlassian Analytics I'm trying to create a stacked bar graph which shows a set of values as a proportion of the total for the bar.
I've actually managed to create this view by adjusting some of the chart settings, but when you hover over the chart, the values shown remain the raw sum, as opposed to the proportion which would be preferable.
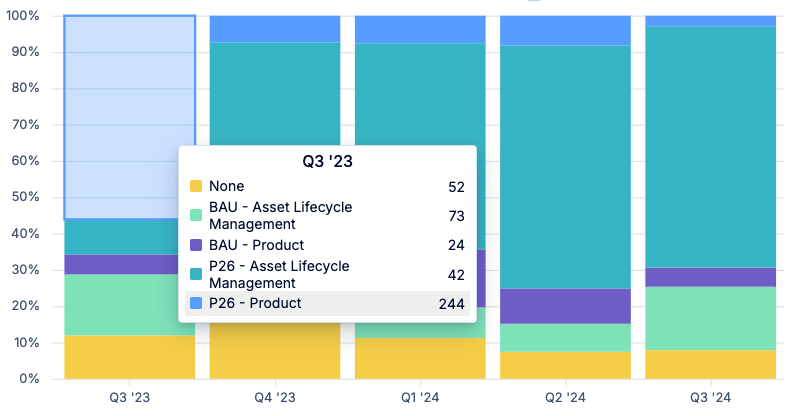
I assume in order to achieve this I need to get the result table to a state where the values represent the 'column ratio' per my date buckets, but I haven't been able to figure out how to calculate that with the formulas/tools provided.
Any suggestions would be much appreciated!


