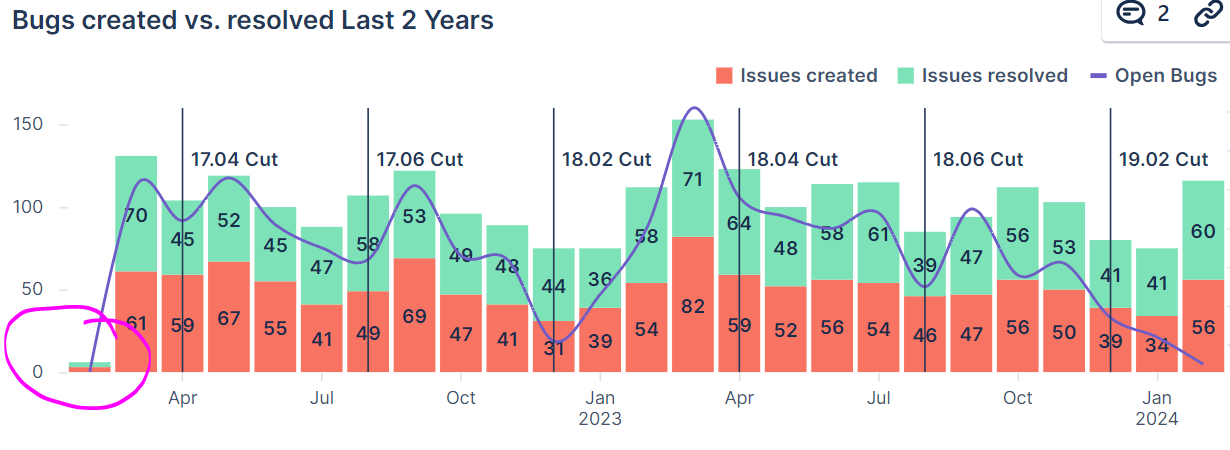
Hi. I have a chart showing bugs created vs resolved month by month for the past 2 years. My problem is that it appears to be a rolling 2 years - so the first month of the chart day by day is getting reduced results and the most recent month is growing. I can live with the most current data growing - but it just seems wrong to have the oldest data shrink day by day.
Can I just hide the first month?
I have tried using both 2 years and 24 months in the queries, but I always end up with 25 monthly bars.