DevOps data from your developer tools connected to Jira Software is now available in the Atlassian Data Lake!
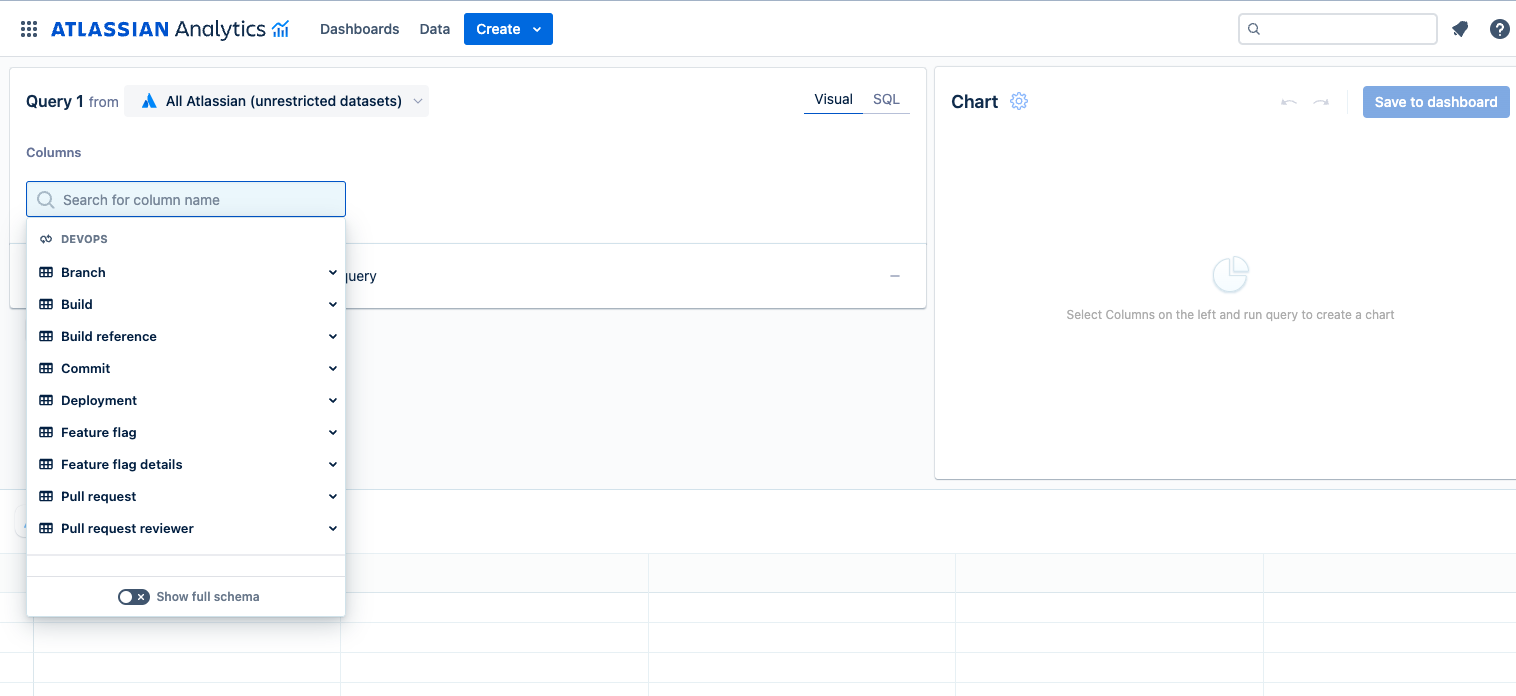
If you’ve connected your source code management, deployment, and release management tools to Jira Software, the DevOps data from those tools are now available in Atlassian Analytics under a handful of new tables. You’ll find these tables under the DEVOPS section in the schema browser of your visual mode queries.
Use the data from the DevOps tables to:
- gain insights into the performance and efficiency of your agile and DevOps processes—identify bottlenecks, detect issues early on, and make informed decisions for continuous improvement
- gain a holistic view of your entire development lifecycle by analyzing the data collected from various sources such as build systems, version control repositories, deployment pipelines, and feature flags
- measure key metrics like deployment frequency, lead time for changes, mean time to recover (MTTR) from failures, and many others
How to get the new tables
For new Data Lake connections that contain Jira Software data, the new DevOps tables will automatically be available going forward.
For existing Data Lake connections, an organization admin needs to edit the connections. If the connection already includes Jira Software data, the organization admin can edit the connection and save it without making any changes. Learn more about editing Data Lake connections.
When you create a query and open the schema browser, you’ll see the new tables under the DEVOPS section. To see all the available DevOps tables, make sure to toggle Show full schema at the bottom of the schema browser.
Read about the DevOps schema.
How to get your DevOps data into the Atlassian Data Lake
If you already have your source code management, continuous deployment, and other dev tooling connected with Jira Software and you're connecting them in your Jira Software issue keys, then you're all set to start using the DevOps tables.
If not, then you’ll need to do the following:
- Find your tools in the catalogue of supported DevOps integrations. For each app, follow the instructions for how to install and connect the app to Jira Software.
- Configure the app to start sending data to Jira Software.
- Add your Jira issue keys in commits, branches, feature flags, etc. to bring context and tracking to your Jira issues.
That’s it! No further installation or connection is needed in Atlassian Analytics. But keep in mind that it could take at least 30 minutes for data to start appearing in the DevOps tables.
Stay tuned for DevOps dashboard templates
In less than a month, we’ll launch new dashboard templates that will have DORA metrics and much more built on top of the available DevOps data. Make sure you watch this product community so you don’t miss the announcement!
Share your feedback about the new DevOps data in the comments or contact support if you have any questions. Thanks, everyone!


