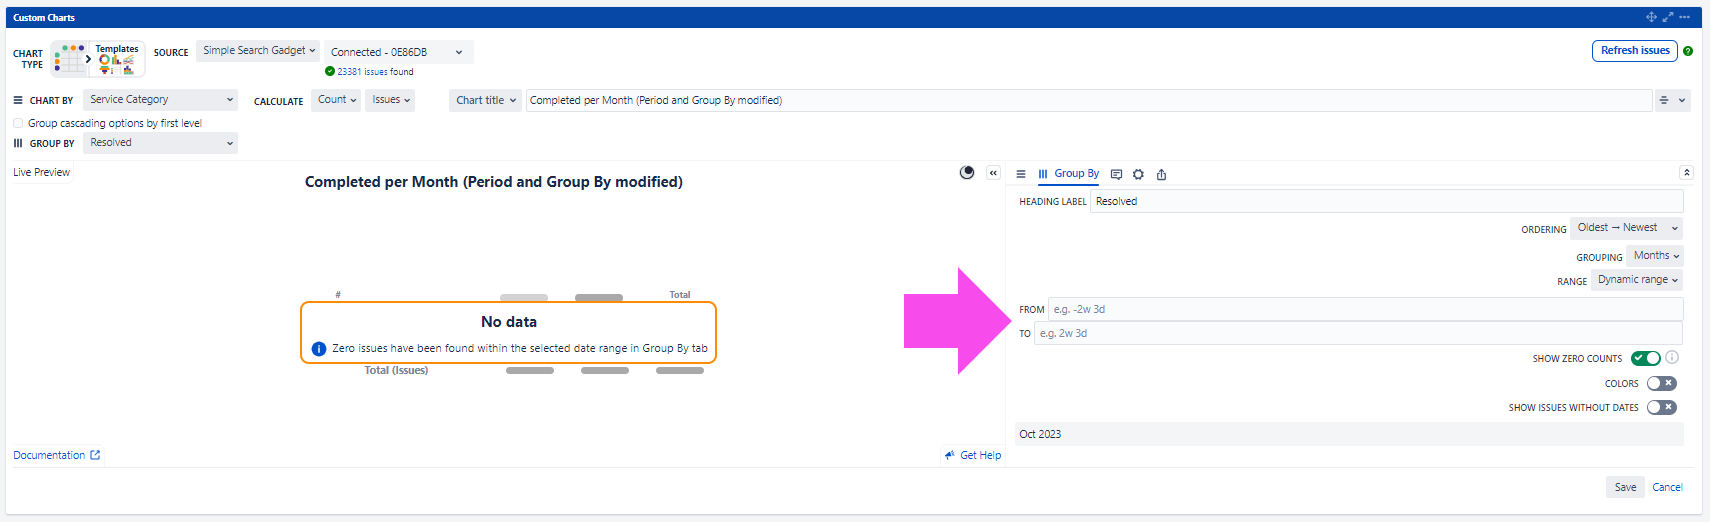
Hi everybody! I am using the Custom Charts gadget in JIRA Service Management Application v4.20.10 and am trying to configure a date range to display values from the previous 12 calendar months, i.e. October 1 2022 -> September 30 2023.
Configuring as “Range: Between Dates” and plugging in the above values works as expected but requires a manual update each month to 'advance the calendar to the right', ensuring the correct reporting period. Using a Dynamic Range would be a much better solution.
I haven't found documentation for the Dynamic Range and have not been able to guess the correct syntax to get the functionality to work as desired. I can successfully report dynamic day or week ranges but this yields statistics for partial months, which I do not want. I want to report on complete calendar months only, and for a 'rolling' 12 month period..
Using JQL, I believe that ">= startofMonth(-13) AND created <= endofMonth(-1)" or ">= startofMonth(-13) AND created < startofMonth()" would provide me the results I want. I have used JQL to pull the correct period through Simple Search and am now trying to configure the chart to suit. Does anyone have experience with this or a solution to offer?