Hi there,
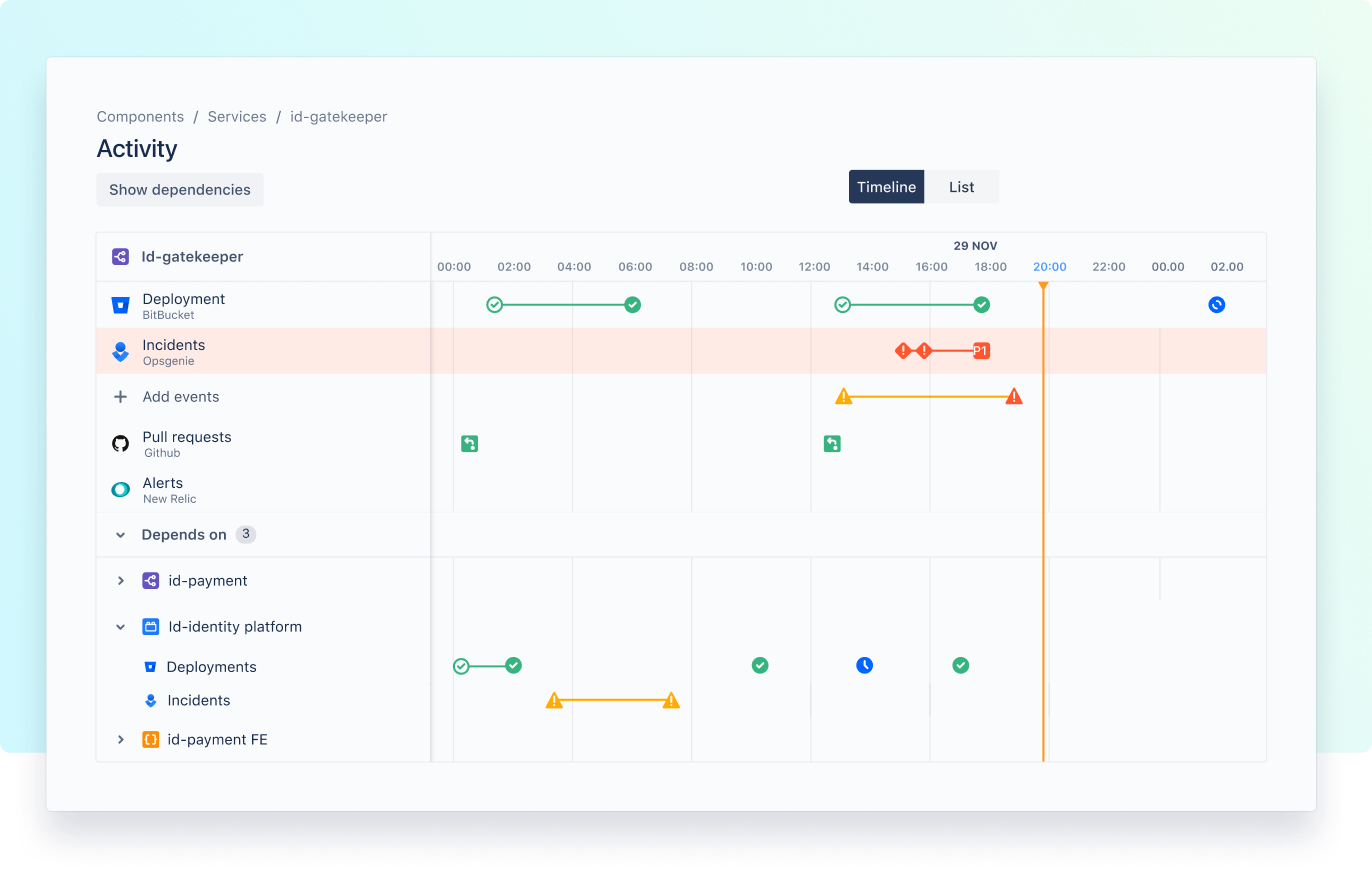
We've started pushing deployment information for a component into Compass and was hoping to get a visualisation in a component's activity timeline that looks like the one bloew from on the Compass site, where the start and end of a deployment is marked by the green line.
I've tried to do this two ways, both unsuccessfully - using the startedAt and completedAt time-date in the deployment event in the json payload where the state was 'SUCCESSFUL' and then also by sending two separate events, one for the state 'IN PROGRESS' with the lastUpdated time being the start time and then other event with the state 'SUCCESSFUL' with the lastUpdated time being the completed time. It seems though that it only records the end time with a single green solid tick, not with a line drawn between the two like the visualisation below.
Am I missing something?
Cheers,
Pete

![Photo of Dave Parrish [Atlassian]](https://us.v-cdn.net/6038660/uploads/avatars/d4/c8/nd4c80c1b9500fc18d4f870969b821564.png)
