Community resources
Community resources
Community resources
Number of incidents within an epic
Hello, is there any panel or report that cannot see the number of incidents that exist within an epic, filtered by incident creation date range?
thanks!
3 answers

You could write a JQL expression to find the issues in the epic (i.e., have the same parent), and filter by the created date.
To learn more about such JQL expressions, please see this documentation and free training from Atlassian:
- https://support.atlassian.com/jira-software-cloud/docs/search-for-issues-in-jira/
- https://support.atlassian.com/jira-software-cloud/docs/what-is-advanced-search-in-jira-cloud/
- https://university.atlassian.com/student/path/849533-gain-project-insights-through-jql
- https://university.atlassian.com/student/activity/1225443-intro-to-jql-in-jira-software-course-description
Kind regards,
Bill
are you looking to see these information for individual epics, or lists of epics?
If it's the former, you may want to have a look at the Issue Matrix app from the Atlassian Marketplace, which should allow displaying the relevant issues (which you can query via JQL as described by @Bill Sheboy) as a panel on the epic. I'm not associated with the vendor so I can't say much more about it.
If you want to see this information for lists of epics, there are Marketplace Apps that can help with this, too. E.g., my team and I work on an app named JXL for Jira in which this would be trivial to do:
For context, JXL is a full-fledged spreadsheet/table view for your issues that allows viewing, inline-editing, sorting, and filtering by all your issue fields, much like you’d do in e.g. Excel or Google Sheets. It also comes with a number of advanced features, including support for (configurable) issue hierarchies, issue grouping by any issue field(s), sum-ups, or conditional formatting. With these, a report like the one above can be built in just a couple of clicks.
Any questions just let me know,
Best,
Hannes
You must be a registered user to add a comment. If you've already registered, sign in. Otherwise, register and sign in.
Hi @Daniel Chirinos,
You could try these two gadgets offered by our Great Gadgets app.
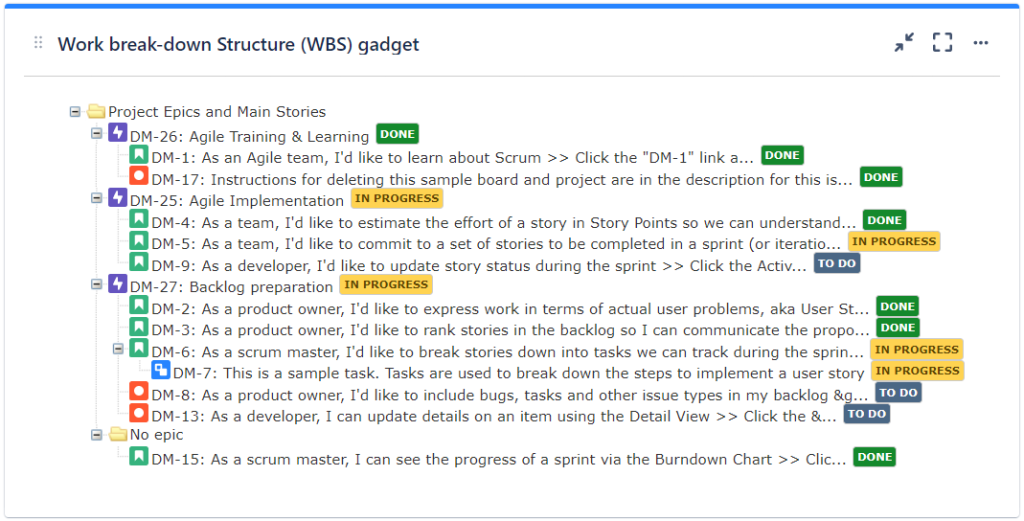
Work Break Down (WBS) Gadget - this gadget displays the issues from a filter by their hierarchy in form of Epics > Stories, Tasks > SubTasks along with their status, thus giving you a quick overview over the epics and their content.

If you create a filter that returns only the epics and the incidents, and then configure the gadget to use that filter, you will obtain the report that you want.
Wallboard Gadget - This gadget can display a board contents, grouping the items by epics.
If you create a filter that returns only the epics and the incidents and then create a Kanban board based on that filter, and then configure the gadget to use that board and display swim-lanes by epics, you will obtain a view with the epics, their number of incidents and the incidents under them.
Please note that this app offers many other gadgets that you will find useful. See the articles from our blog, to make an idea. I can be a great asset for your team or company.
Danut.
You must be a registered user to add a comment. If you've already registered, sign in. Otherwise, register and sign in.


You must be a registered user to add a comment. If you've already registered, sign in. Otherwise, register and sign in.