Hi,In my project i have 40 task in 20 epics( all 40 tasks are in each epic), i would like to see data as Below table. Please help me to get this.
If you use pivot table macro in confluence with the calculated value as literal it should give you the table you're looking for.
Hi @Gopi L ,
While I don't see a gadget that does exactly look like you want, you can come very close with a two dimensional issue statistics gadget where you define:
The gadget may look somewhat like this:
For each epic you can see how many issues are in each status.
Hope this helps!
Thanks for the replay.But i want exact one which i posted.
Hi @Gopi L,
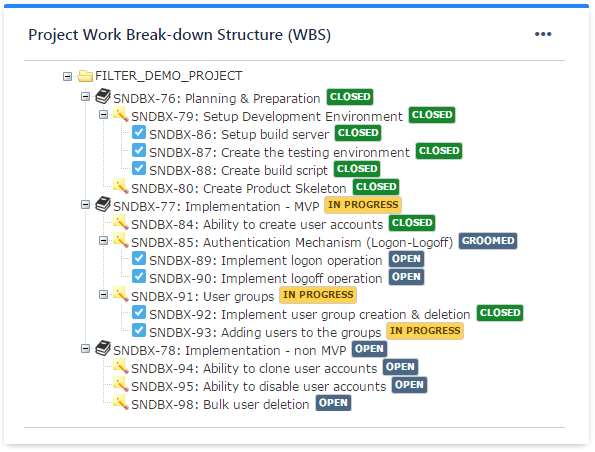
You might not find such a gadget. But, instead you could use the Work Break-Down Structure (WBS) gadget offered by our Great Gadgets app.
This gadget displays the issues from a filter in the structure EPIC > Stories > Sub-tasks along with their status, in a tree structure
All you have to do, is to create a Jira filter that returns the Epics and the tasks from that epic, and configure this gadget to use that filter.
This app offers many other gadgets that you might find useful.
If you have questions, please don't hesitate to contact us at support@stonikbyte.com.
Thank you,
Danut M
Hi @Gopi L,This is achievable with Pivot Report for Jira we develop:
In the example above I used Projects as rows due to the demo data we have. This summary table is available both as a part of a standalone report and dashboard gadget.You can play with the demo report here: https://demo.colined.com/plugins/servlet/pr/report?report=180
Thanks for the replay,is it possible to get any video demonstration to understand it .
Thanks for the replay. it's partially ok.
It looks like you're new here. Sign in or register to get started.