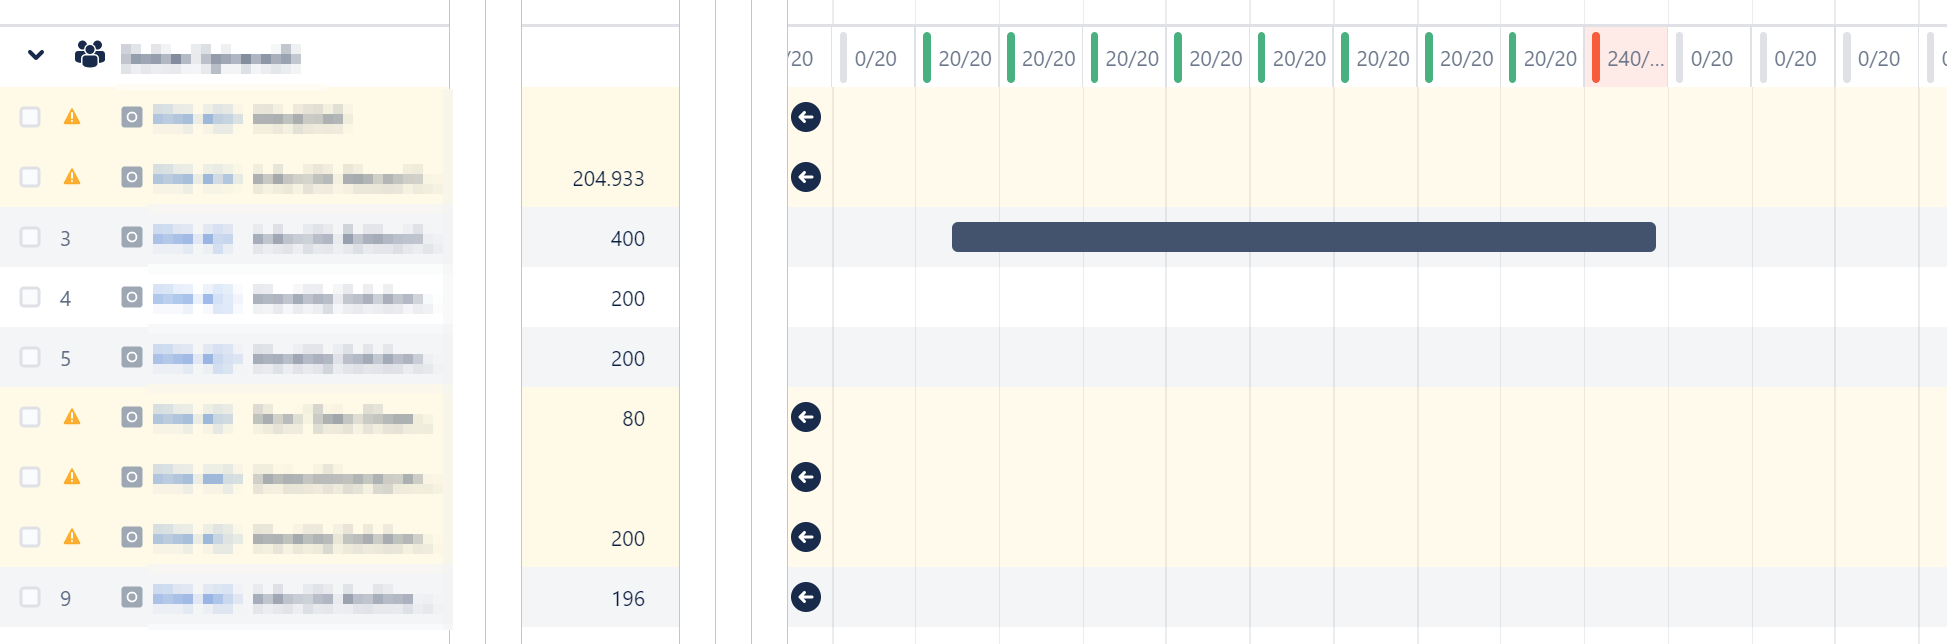
I am playing around with Kanban capacity planning visualization in Advanced Roadmaps and it looks like that instead of spreading the estimated hours evenly across the iterations (ie. weeks) between start and end date, Advance Roadmaps always assumes 100% of the capacity per iteration up until the last, when it all piles up and turns red.
Is there any way to have this show similar to eg. BigPicture? There I could immediately see, if a task is overloading a team and how allocating more time could make it feasible. Am I missing something (or even the point) here? Thanks in advance!