Create Sign up Log in
Turn on suggestions
Auto-suggest helps you quickly narrow down your search results by suggesting possible matches as you type.
Showing results for
Community resources
Community resources
como gerar graficos / dashboard para analise da produtividade
gostaria de analisar os dias de pico de demandas para organizar melhor o fluxo de demandas entre os colaboradores e dias da semana.
1 answer
Antonio Panea
Rising Star 
May 8, 2020 edited 
Rising Star
Rising Stars are recognized for providing high-quality answers to other users. Rising Stars receive a certificate of achievement and are on the path to becoming Community Leaders.
Hi @Semira ,
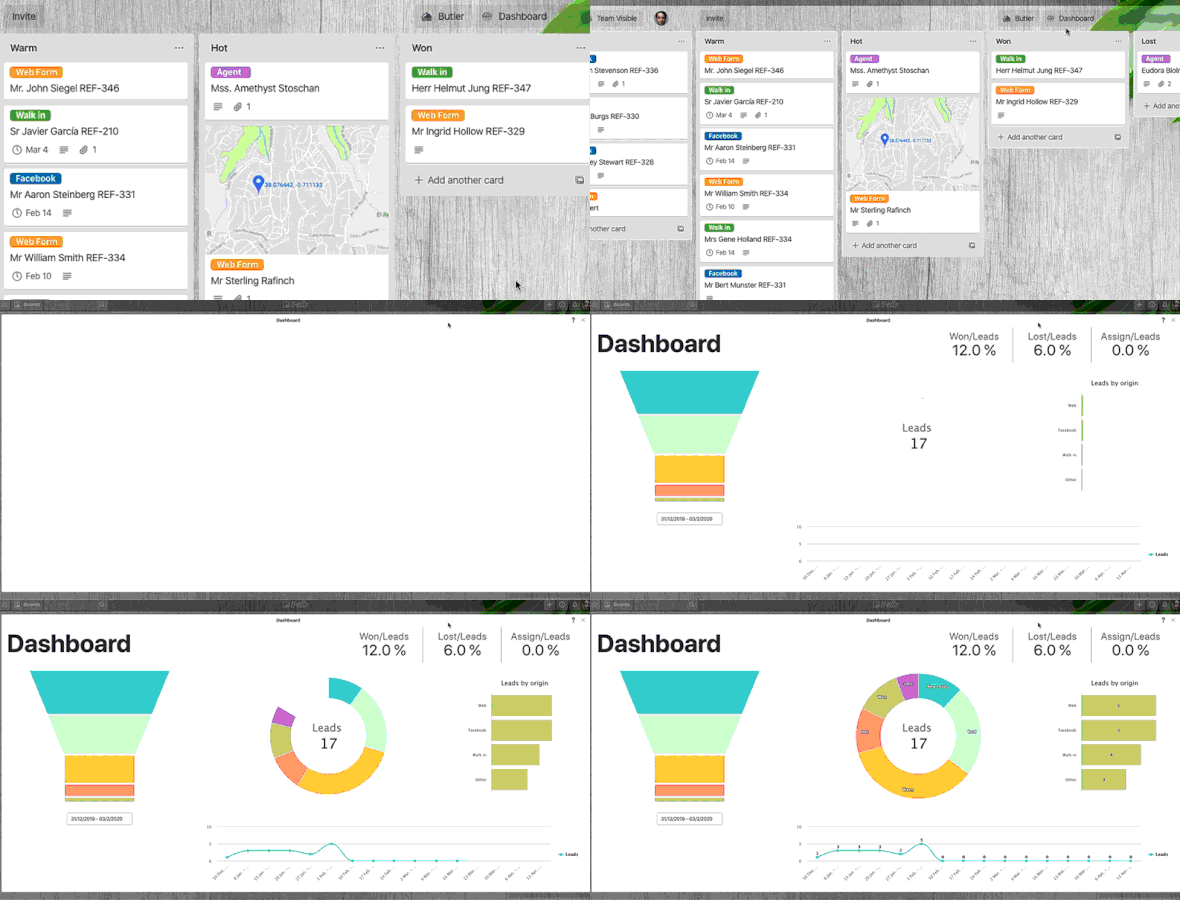
thanks for reaching out! Take a look on Crmble Power-Up . You have dashboard that shows what is happening in your Trello board. In which stages de you have your cards, how many of them are finished, KPIs, if they are or they are not assigned... So I would suggest you to take a look.
If you need any help just let me know!
Cheers
Toni

Was this helpful?
Thanks!
- FAQ
- Community Guidelines
- About
- Privacy policy
- Notice at Collection
- Terms of use
- © 2024 Atlassian


You must be a registered user to add a comment. If you've already registered, sign in. Otherwise, register and sign in.