Community resources
Community resources
- Community
- Products
- Jira Software
- Questions
- When will the control (or lead time tracking of some form) be available for next gen projects?
When will the control (or lead time tracking of some form) be available for next gen projects?
Currently the next gen roadmap lists control charts arriving some time in 2020. Given that we are more than half way through the year, do you have a delivery estimate that is more granular than 'some time in the next 6 months'?
Not having a way to track lead and cycle time significantly detracts from the value I get from Jira.
2 answers
Hello @Ben Kelly ,
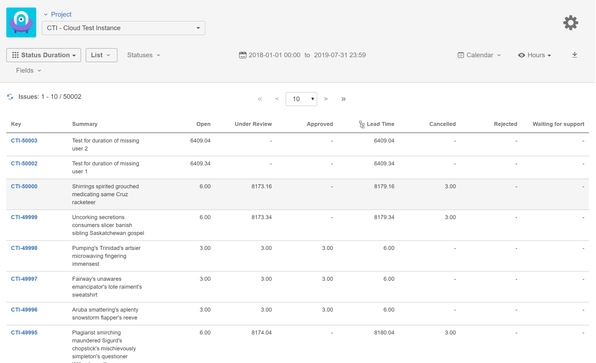
If you are interested in a ready built solution, our team at OBSS built Time in Status app for this exact need. The app produces reports much more detailed than the control chart and gives you much more control over the reports.
It is available for Jira Server, Cloud and Data Center.
Time in Status allows you to see how much time each issue spent on each status or assigned to each assignee or group. You can combine statuses into consolidated columns to see metrics like Age, Resolution Time, Cycle Time or Lead Time. For these metrics, the report is not bound by board columns, you can individually select which statuses to include or exclude. All durations can be display in various formats including days, hours, minutes even seconds.
You can get the report for a project, a user, for a saved filter or even a custom JQL query.
It can calculate averages and sums of those durations grouped by issue fields you select. (For example see the average Cycle Time per project and per issuetype or see the sum of InProgress time per component).
Time in Status uses Jira issue histories to calculate its reports so you can use the app to get reports on your past issues as well.
The app has custom calendar support so you can get your reports based on a 24/7 calendar or your custom business calendar. (This one is important because a 24/7 calendar in most cases shows misleading data. For example an issue created at 16:00 on Friday and was resolved at 09:00 on next Monday seems to stay open for 2,5 days but in terms of business hours, it is only a few hours. You can see this using Time in Status by OBSS.)
Using Time in Status you can:
- See how much time each issue spent on each status, assignee, user group and also see dates of status transitions. Get metrics like Lead Time or Cycle Time.
- Calculate averages and sums of those durations grouped by issue fields you select. (For example see average InProgress time per project and per issuetype.)
- Export your data as XLS, XLSX or CSV.
- Access data via REST API.
- Use one of various charts type for your reports.
https://marketplace.atlassian.com/1211756
EmreT
While we're all waiting for a Control Chart for nextgen project, you can try to calculate Cycle and Lead Time with Time between Statuses. You can set a time limit with notifications.
Also, the ability to monitor data for each issue in Graph and Charts View on Issue View Panel is very helpful.
If you have any additional questions, I'm here to help you:)
Best regards, Mariana
You must be a registered user to add a comment. If you've already registered, sign in. Otherwise, register and sign in.

Was this helpful?
Thanks!
DEPLOYMENT TYPE
CLOUDPRODUCT PLAN
STANDARDPERMISSIONS LEVEL
Site AdminTAGS
Community showcase
Atlassian Community Events
- FAQ
- Community Guidelines
- About
- Privacy policy
- Notice at Collection
- Terms of use
- © 2024 Atlassian


You must be a registered user to add a comment. If you've already registered, sign in. Otherwise, register and sign in.