Community resources
Community resources


- Community
- Products
- Apps & Integrations
- Questions
- Gantt Chart from Table from Confiform
Gantt Chart from Table from Confiform
I have been able to get my Gantt Chart working on a Chart from table, pulled from a Confiform action log.
Using help from this link -
https://docs.stiltsoft.com/display/public/TFAC/Gantt+chart+type#ChartParameters-Selectthecharttype
I am stuck on one thing though - how do I get the X-Axis of the Gannt Chart labels to appear above the data?
2 answers

Hi there,
As this Community thread mentions our Table Filter and Charts for Confluence app, we are happy to introduce its new macro – Table Spreadsheet.
The new macro allows you to work with fully functional Excel spreadsheets right in Confluence.
You’ll be able to use cells’ formulas, filters, conditional formatting, etc., create pivot tables and charts from the page view and edit mode.
The Table Spreadsheet macro is available for Cloud and Server/Data Center.


Adding the expert @Katerina Kovriga {Stiltsoft} for assistance.
You must be a registered user to add a comment. If you've already registered, sign in. Otherwise, register and sign in.
The link to our documentation is correct, at the beginning of the post is a screenshot of the page in the edit mode: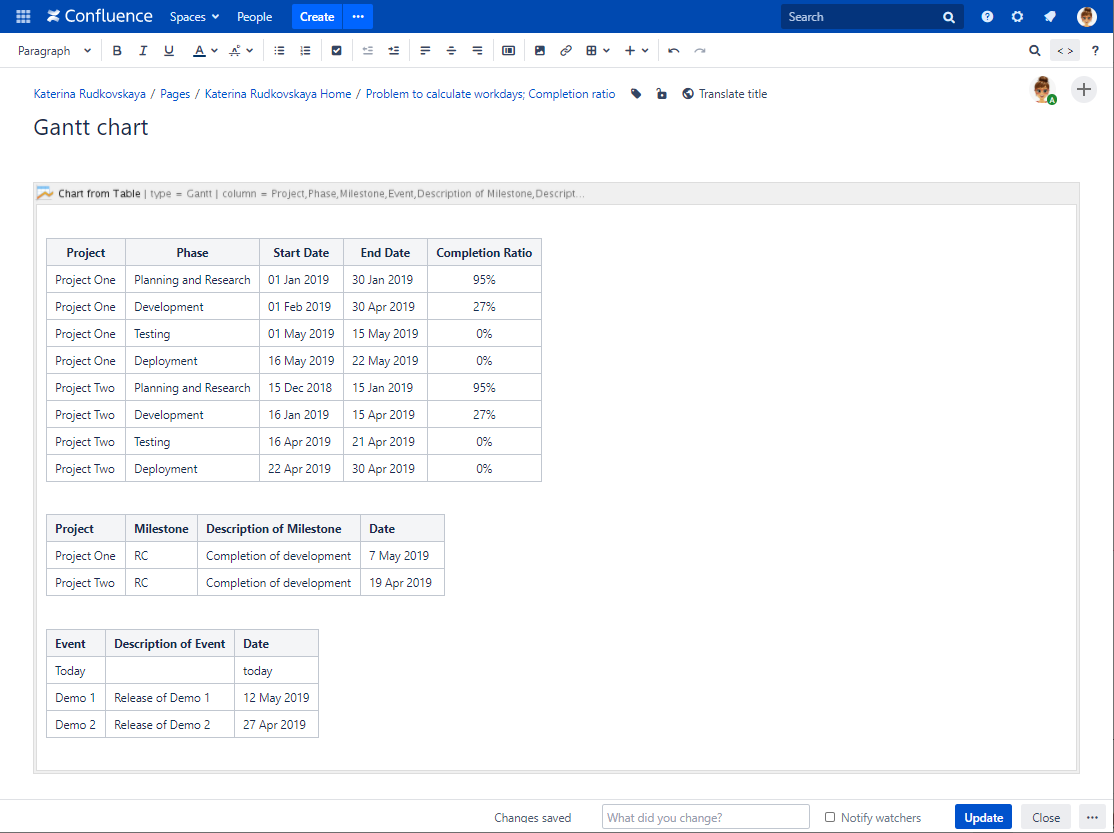
The X-axis is based on dates - the full algorithm how to build a chart is also shown in the post. If you are talking about the milestones/events, they go to the Labels column - nothing more to add from my side.
Try to build a chart using plain manually created tables, then try to repeat the same actions using your Confiforms.
You must be a registered user to add a comment. If you've already registered, sign in. Otherwise, register and sign in.

Was this helpful?
Thanks!
- FAQ
- Community Guidelines
- About
- Privacy policy
- Notice at Collection
- Terms of use
- © 2024 Atlassian
You must be a registered user to add a comment. If you've already registered, sign in. Otherwise, register and sign in.