Community resources
Community resources
- Community
- Products
- Apps & Integrations
- Questions
- Returning Bar Graphs From JIRA filters
Returning Bar Graphs From JIRA filters

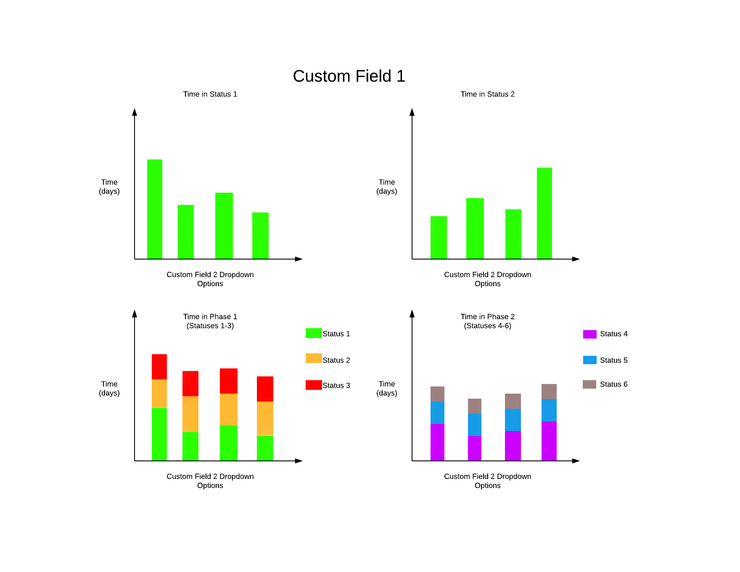
I've been tasked with provided metrics on how long tickets take to get through statuses and "phases" (groups of statuses). Leadership specifically wants bar graphs. I can do this manually, but I'm hoping there's a way to do it in Confluence / JIRA.
I've created filters that narrow down my tickets based on which group (Custom Field 1). I need a bar graph that tells me within that group, what the average time tickets spend in status 1, 2, 3, etc. based on what document type is was (Custom Field 2). Then I need a stacked bar graph that shows average time in "phases" (a combination of time in statuses 1-3) again, based on Custom Field 2. [Diagram example included]
Using the Time in Status macro/gadget I've kinda got something similar, but it's line graphs with an average per month, which is NOT what I need.
We're not picky as to whether this is done as a Confluence page or as a JIRA dashboard as long as it shows the correct data we need.
2 answers
1 accepted

If Excel is also an option, you can easily create this chart with Better Excel:
Have a look at the workflow-report.xlsx template and its corresponding workflow-report.groovy script. The latter creates some time metrics like "Time in <Status Name Here>", "Time to first response" and so. You can modify the script to produce your custom time metrics.
Then you can create a chart or a pivot chart to visualize that, leading to some result like the blow.
Also see more samples: http://www.midori-global.com/products/jira-better-excel-plugin/template-gallery#workflow-reports

Close enough! I was able to use this to create a "report" page. Thank you so much!
You must be a registered user to add a comment. If you've already registered, sign in. Otherwise, register and sign in.

Did you try the Jira Charting Plugin yet?
You must be a registered user to add a comment. If you've already registered, sign in. Otherwise, register and sign in.

That's what I'm currently using. The charting plugin includes the Time in Status macro that I mentioned. Some of the macros in that plugin are perfect and do exactly what I need them to do for other things, but for this one page none of those macros work.
You must be a registered user to add a comment. If you've already registered, sign in. Otherwise, register and sign in.

I talked to Gaudenz Alder from draw.io in Barcelona last year. He was developing a possibility to visualize dynamic data based on JQL queries within draw.io diagrams on Confluence pages. Maybe they've already implemented that functionality or maybe he can help you with that.
You must be a registered user to add a comment. If you've already registered, sign in. Otherwise, register and sign in.

I will definitely look into that! Thanks!
You must be a registered user to add a comment. If you've already registered, sign in. Otherwise, register and sign in.
Hi Heth, What solution did you end up with? Any tips? I am trying to do the exact same thing.
You must be a registered user to add a comment. If you've already registered, sign in. Otherwise, register and sign in.

Was this helpful?
Thanks!
- FAQ
- Community Guidelines
- About
- Privacy policy
- Notice at Collection
- Terms of use
- © 2024 Atlassian


You must be a registered user to add a comment. If you've already registered, sign in. Otherwise, register and sign in.