Community resources
Community resources


What can't a project manager do without when working with Jira?
Jira users, especially project managers, face a major problem – calculating and summarizing time at Epic level.
Jira doesn't have this functionality, so project managers have to spend resources on transferring data from Jira to Excel to find out how much time was spent. And it' s not the automated system doing this, it’s an employee, so this is extremely inconvenient and time-consuming.
There is another problem: business and stakeholders ask for exact deadlines for the project, which are difficult to predict.
Today we will tell you about Epic Timesheets for Jira app which became a "salvation" for project managers – it sums up spent time, shows the percentage of deviation from the planned time for the epics and also helps to predict the terms of future epics based on the analysis of existing information. More about it all, though. 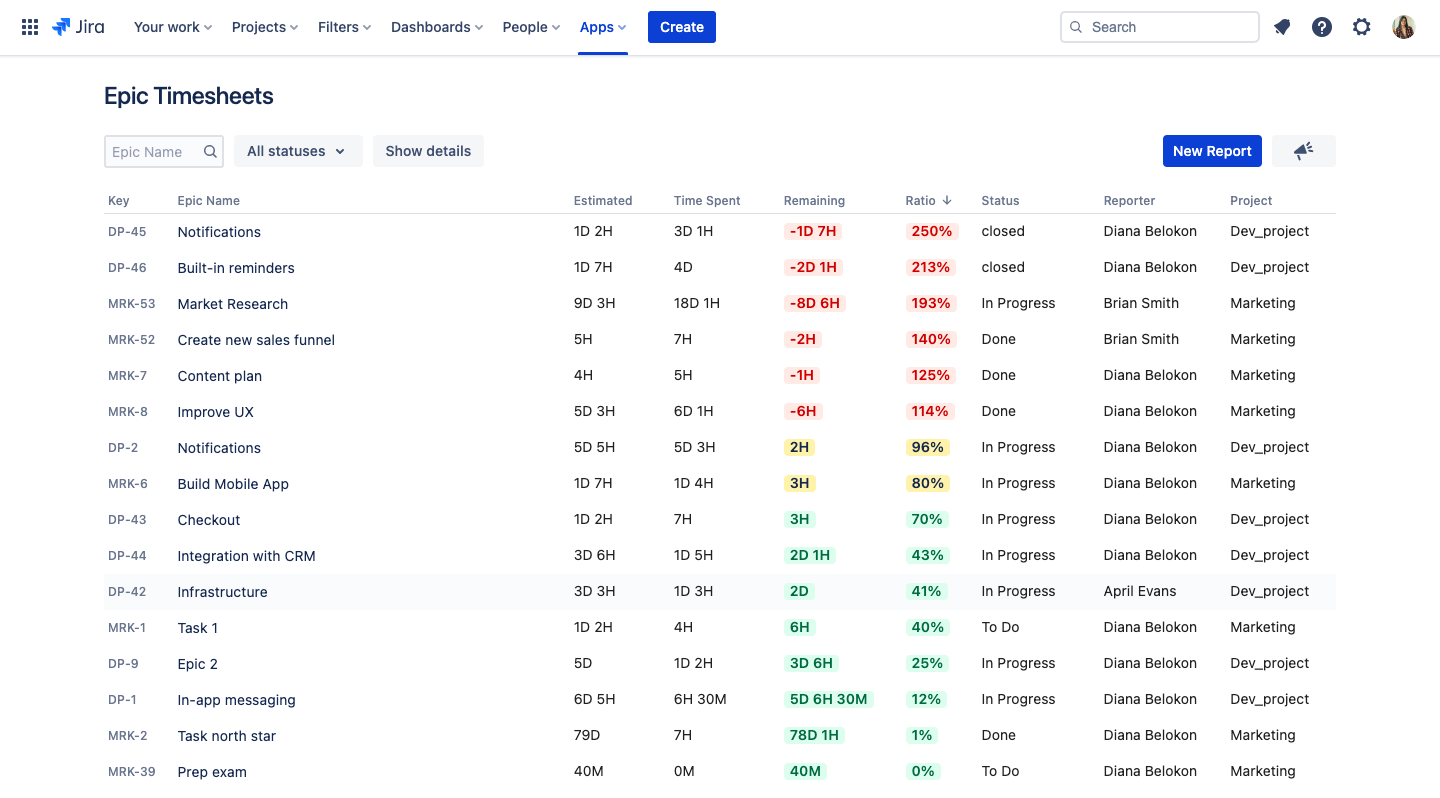 Get reports on selected Epics
Monitoring deadlines
Project managers can monitor timelines on epics while they're working. Keep track of whether employees are on schedule or not. By doing this, you'll be able to see the balance difference and what might have gone wrong in the process. It’s convenient because there is a possibility to look at the whole epic, instead of opening each task and checking out what has been done for it.
Forecasting timelines for a future epic
Based on the analysis and summarizing of existing information for a certain period, you will be able to predict the timing of future epics. For instance, look at the closed epics report and see the plan/fact and the percentage of deviation that's important to know. Why? Knowing its value can be useful for predicting the timing of a future epic.
Planning
If you're developing a project for a business, you'll be able to tell the exact time when the feature will be released. Epic Estimate, which estimates development timelines based on all epic child tasks, will help you with this.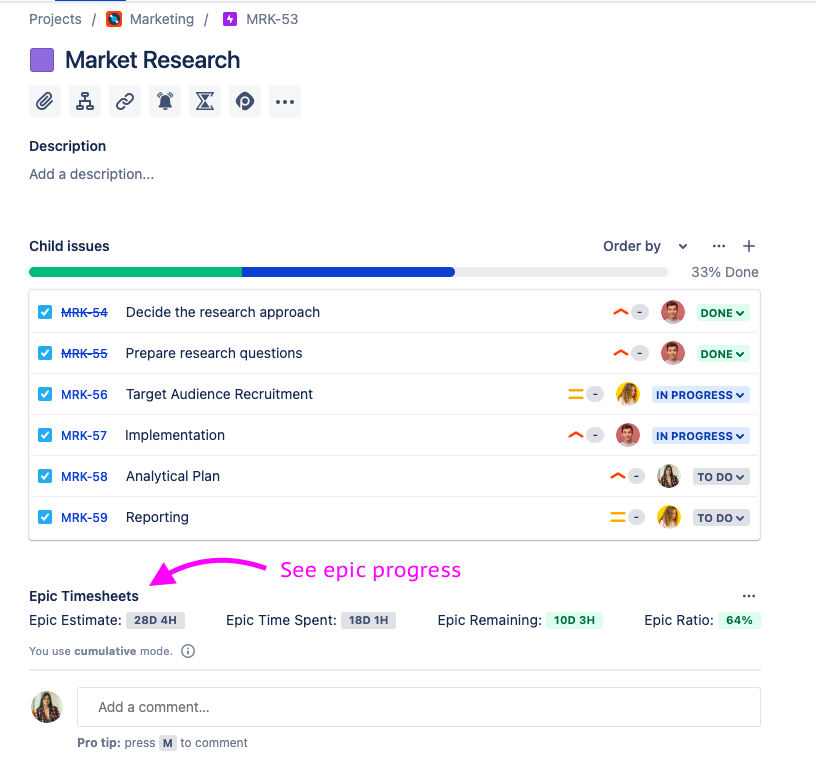 Tracking the epic's progress from the issue
Report on multiple epics
Project managers will also find it useful to look at the Epic Ratio data in the Multiple Epic Report. The Ratio (percentage of the spent time) field shows the percentage difference between actual and planned costs. In this way you can see by what percentage you usually deviate from the planned time, and the next time you plan, you can take this error into account (consideration).
Also, for a quick visual reading, the Epic Remaining and Epic Ratio fields are colour-coded. If the Epic Ratio exceeds 100%, the data in the field turns red - indicating that you have exceeded your epic time allotment. When the ratio between actual time spent and planned time is between 71-100% - the data is highlighted in yellow, 0-70% in green.
So if you're using Jira, we suggest you try our Epic Timesheets for Jira app. Its handy functionality will make work easier for you as a project manager and for your employees.
Was this helpful?
Thanks!
Diana Belokon

Atlassian Community Events
- FAQ
- Community Guidelines
- About
- Privacy policy
- Notice at Collection
- Terms of use
- © 2024 Atlassian
0 comments