Community resources
Community resources


Reports in Jira, Which report type is best for your team? | Jira Guru
Hi Everyone! 👋
Welcome again to Weekly knowledge growth with Jira Guru!
Today's topic is Reports in Jira, Which report type is best for your team?
----------
So, first things first: what is a Jira report? Basically, it's a fancy way of looking at all the data stored in Jira and figuring out how your team is doing. Reports can tell you things like how much work you're getting done, how fast you're doing it, and whether there are any roadblocks in your way.
The Value of Jira Reports
One of the coolest things about Jira reports is that they can help you track progress over time. By looking at the data in a report, you can see whether your team is getting faster, more efficient, or running into more roadblocks. This can help you make adjustments to your workflow, set realistic goals, and measure your success.
Another great thing about Jira reports is that they're customizable. Most reports let you filter the data by things like date range, issue type, or user, which means you can get a really specific view of your team's work. And if you need to share the report with someone else, you can export it as a CSV or PDF file and send it over.
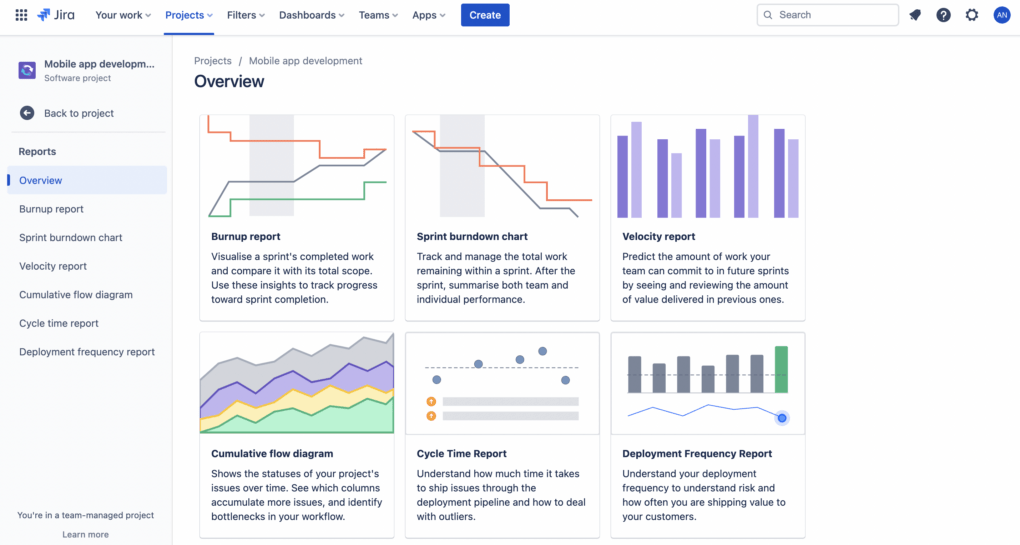
Generating a report
To generate a report:
- Navigate to the project you want to report on.
- From the project sidebar, select Reports. If you don't see it, go to "project setting", and choose "feature" to enable it. The report's overview page displays.
- Select a report from the overview or from the project sidebar to begin generating the report. View the list of reports below for more details of each report.
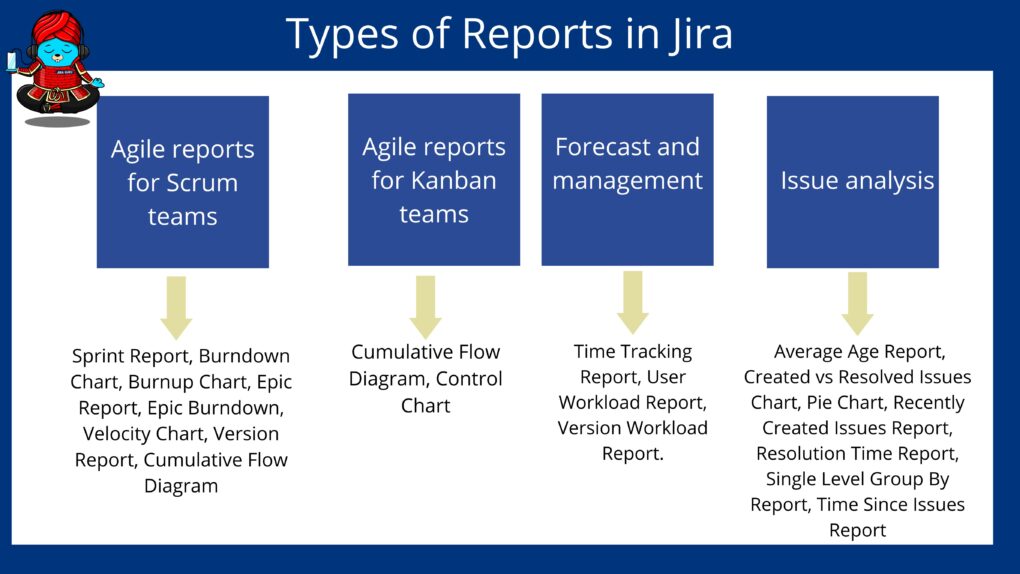
Types of Reports in Jira:
Jira offers several types of reports, each designed to provide insights into different aspects of your project. Within each type of report, there are multiple specific reports available.
- Agile reports for Scrum teams: Sprint Report, Burndown Chart, Burnup Chart, Epic Report, Epic Burndown, Velocity Chart, Version Report, Cumulative Flow Diagram
- Agile reports for Kanban teams: Cumulative Flow Diagram, Control Chart
- Forecast and management: Time Tracking Report, User Workload Report, Version Workload Report.
- Issue analysis: Average Age Report, Created vs Resolved Issues Chart, Pie Chart, Recently Created Issues Report, Resolution Time Report, Single Level Group By Report, Time Since Issues Report
 By leveraging the different types of reports available in Jira, you can gain valuable insights into your team's work and progress, track progress over time, identify bottlenecks and areas for improvement, and communicate progress to stakeholders.
Which report type is best for your team?
Reports for team-managed software project
1. Burnup Chart
- Applies to: Sprints
- Provides a visual representation of a sprint's scope, as well as its remaining work.
- This helps your team stay on track.
- In team-managed projects, the Burnup report can only be used if you have the Sprints feature enabled
2. Velocity Chart
- Applies to: Sprints
- Tracks the amount of work completed from sprint to sprint.
- This helps you determine your team's velocity, and estimate the work your team can realistically achieve in future sprints.
- The Velocity Chart will be displayed, showing the last 7 sprints completed by the team.
Reports for Scrum projects
1. Burndown Chart
- Applies to: Sprints
- Tracks the total work remaining, and projects the likelihood of achieving the sprint goal.
- This helps your team manage its progress and respond accordingly.
- The Burndown Chart only applies to Scrum boards.
2. Burnup Chart
- Applies to: Sprints
- Provides a visual representation of a sprint's scope, as well as its remaining work.
- This helps your team stay on track.
3. Sprint Report
- Applies to: Sprints
- Shows the work completed or pushed back to the backlog in each sprint.
- This helps you determine if your team is overcommitting or if there is scope creep.
- This page only applies to Scrum boards.
4. Control Chart
- This applies to: Projects, versions, or sprints
- Shows the cycle time for your product, version, or sprint.
- This helps you identify whether data from the current process can be used to determine future performance.
5. Cumulative Flow Diagram
- Applies to: Any period of time
- Shows the statuses of issues over time.
- This helps you identify potential bottlenecks that need to be investigated.
6. Epic Report
- Applies to: Epics
- Shows the progress towards completing an epic over time.
- This helps you manage your team's progress by tracking the remaining incomplete and unestimated work.
- This page only applies to Scrum boards.
7. Epic Burndown
- Applies to: Epics
- Similar to the Epic Report, but optimized for Scrum teams that work in sprints. Tracks the projected number of sprints required to complete the epic.
- This helps you monitor whether the epic will release on time, so you can take action if work is falling behind.
8. Release Burndown
- Applies to: Versions
- Similar to the Version Report, but optimized for Scrum teams that work in sprints.
- Tracks the projected release date for a version. This helps you monitor whether the version will release on time, so you can take action if work is falling behind.
9. Velocity Chart
- Applies to: Sprints
- Tracks the amount of work completed from sprint to sprint.
- This helps you determine your team's velocity, and estimate the work your team can realistically achieve in future sprints.
10. Version Report
- Applies to: Versions
- Tracks the projected release date for a version.
- This helps you monitor whether the version will release on time, so you can take action if work is falling behind.
Reports for Kanban projects
1. Control Chart
- Applies to: Projects, versions, or sprints
- Shows the cycle time for your product, version, or sprint.
- This helps you identify whether data from the current process can be used to determine future performance.
2. Cumulative Flow Diagram
- This applies to: Any period of time
- Shows the status of issues over time.
- This helps you identify potential bottlenecks that need to be investigated.
Common Questions About Jira Reports
Can Jira Generate Document Reports?
Yes, Jira can generate document reports in formats like CSV and PDF. You can export reports as files and share them with others as needed.
Can You Automate Jira Reports?
Yes, Jira offers automation capabilities through its add-ons and integrations. You can set up automated reports to be generated and emailed on a regular basis, saving you time and effort.
Jira reports are a valuable tool for teams looking to track progress, make data-driven decisions, and communicate with stakeholders. By following the steps outlined in this beginner's guide, you can create custom reports that provide insights into your team's work and progress. Whether you're using Scrum, Kanban, or another methodology, there are reports available that can help you achieve your goals.
--------
Learn more about Jira, Confluence and Atlassian with Jira Guru
💬 Questions? Use the comment section!
🙌 Please like, and share this article with new beginners
Was this helpful?
Thanks!
Teresa

About this author
Product Marketing
DevSamurai
19 accepted answers
Atlassian Community Events
- FAQ
- Community Guidelines
- About
- Privacy policy
- Notice at Collection
- Terms of use
- © 2024 Atlassian
0 comments