Community resources
Community resources
Prometheus Exporters: monitoring web requests
Hello! In this article we will talk about web requests monitoring with Prometheus Exporters.
Prometheus Exporters exist in two versions – Lite (free version) and Pro (payed version).
There are 4 Lite versions – Prometheus Exporter for Jira Lite, Prometheus Exporter for Confluence Lite, Prometheus Exporter for Bitbucket Lite, Prometheus Exporter for Bamboo. And 3 Pro versions – Prometheus Exporter For Jira Pro, Prometheus Exporter for Confluence Pro, Prometheus Exporter for Bitbucket Pro.
Through this article I will let you know which versions of Prometheus Exporters support web requests monitoring and the difference between Lite and Pro versions.
Prometheus Exporter for Bitbucket Lite and Prometheus Exporter for Bamboo do not support web request monitoring at all.
By default all web requests are monitored and metrics provided.
These metrics are called: jira_request_duration_on_path for Prometheus Exporter for Jira Lite and Pro, confluence_request_duration_on_path for Prometheus Exporter for Confluence Lite and Pro, bitbucket_request_duration_on_path for Prometheus Exporter for Bitbucket Pro.
Those metrics are histogram metrics. You can read more information on histogram metrics here.
We will take Jira as an example while talking about web requests monitoring, but the same can be applied to Confluence and Bitbucket.
Out of the box monitoring
By default you can see the following metrics:
bitbucket_request_duration_on_path_bucket{path="/rest",le="0.005",} 3.0
bitbucket_request_duration_on_path_bucket{path="/rest",le="0.01",} 22.0
bitbucket_request_duration_on_path_bucket{path="/rest",le="0.025",} 36.0
bitbucket_request_duration_on_path_bucket{path="/rest",le="0.05",} 37.0
bitbucket_request_duration_on_path_bucket{path="/rest",le="0.075",} 39.0
bitbucket_request_duration_on_path_bucket{path="/rest",le="0.1",} 39.0
bitbucket_request_duration_on_path_bucket{path="/rest",le="0.25",} 39.0
bitbucket_request_duration_on_path_bucket{path="/rest",le="0.5",} 39.0
bitbucket_request_duration_on_path_bucket{path="/rest",le="0.75",} 41.0
bitbucket_request_duration_on_path_bucket{path="/rest",le="1.0",} 41.0
bitbucket_request_duration_on_path_bucket{path="/rest",le="2.5",} 41.0
bitbucket_request_duration_on_path_bucket{path="/rest",le="5.0",} 42.0
bitbucket_request_duration_on_path_bucket{path="/rest",le="7.5",} 42.0
bitbucket_request_duration_on_path_bucket{path="/rest",le="10.0",} 42.0
bitbucket_request_duration_on_path_bucket{path="/rest",le="+Inf",} 42.0
bitbucket_request_duration_on_path_count{path="/rest",} 42.0
bitbucket_request_duration_on_path_sum{path="/rest",} 5.382160883
bitbucket_request_duration_on_path_bucket{path="/plugins",le="0.005",} 0.0
bitbucket_request_duration_on_path_bucket{path="/plugins",le="0.01",} 6.0
bitbucket_request_duration_on_path_bucket{path="/plugins",le="0.025",} 13.0
bitbucket_request_duration_on_path_bucket{path="/plugins",le="0.05",} 13.0
bitbucket_request_duration_on_path_bucket{path="/plugins",le="0.075",} 13.0
bitbucket_request_duration_on_path_bucket{path="/plugins",le="0.1",} 13.0
bitbucket_request_duration_on_path_bucket{path="/plugins",le="0.25",} 18.0
bitbucket_request_duration_on_path_bucket{path="/plugins",le="0.5",} 19.0
bitbucket_request_duration_on_path_bucket{path="/plugins",le="0.75",} 19.0
bitbucket_request_duration_on_path_bucket{path="/plugins",le="1.0",} 20.0
bitbucket_request_duration_on_path_bucket{path="/plugins",le="2.5",} 20.0
bitbucket_request_duration_on_path_bucket{path="/plugins",le="5.0",} 20.0
bitbucket_request_duration_on_path_bucket{path="/plugins",le="7.5",} 20.0
bitbucket_request_duration_on_path_bucket{path="/plugins",le="10.0",} 21.0
bitbucket_request_duration_on_path_bucket{path="/plugins",le="+Inf",} 21.0
bitbucket_request_duration_on_path_count{path="/plugins",} 21.0
bitbucket_request_duration_on_path_sum{path="/plugins",} 10.423385203000002
bitbucket_request_duration_on_path_bucket{path="/download",le="0.005",} 32.0
bitbucket_request_duration_on_path_bucket{path="/download",le="0.01",} 32.0
bitbucket_request_duration_on_path_bucket{path="/download",le="0.025",} 33.0
bitbucket_request_duration_on_path_bucket{path="/download",le="0.05",} 35.0
bitbucket_request_duration_on_path_bucket{path="/download",le="0.075",} 35.0
bitbucket_request_duration_on_path_bucket{path="/download",le="0.1",} 35.0
bitbucket_request_duration_on_path_bucket{path="/download",le="0.25",} 35.0
bitbucket_request_duration_on_path_bucket{path="/download",le="0.5",} 38.0
bitbucket_request_duration_on_path_bucket{path="/download",le="0.75",} 39.0
bitbucket_request_duration_on_path_bucket{path="/download",le="1.0",} 41.0
bitbucket_request_duration_on_path_bucket{path="/download",le="2.5",} 52.0
bitbucket_request_duration_on_path_bucket{path="/download",le="5.0",} 56.0
bitbucket_request_duration_on_path_bucket{path="/download",le="7.5",} 56.0
bitbucket_request_duration_on_path_bucket{path="/download",le="10.0",} 56.0
bitbucket_request_duration_on_path_bucket{path="/download",le="+Inf",} 56.0
bitbucket_request_duration_on_path_count{path="/download",} 56.0
bitbucket_request_duration_on_path_sum{path="/download",} 33.799080099
Let’s talk about bitbucket_request_duration_on_path_bucket with the /rest label:
bitbucket_request_duration_on_path_bucket{path="/rest",le="0.005",} 3.0
bitbucket_request_duration_on_path_bucket{path="/rest",le="0.01",} 22.0
bitbucket_request_duration_on_path_bucket{path="/rest",le="0.025",} 36.0
bitbucket_request_duration_on_path_bucket{path="/rest",le="0.05",} 37.0
bitbucket_request_duration_on_path_bucket{path="/rest",le="0.075",} 39.0
bitbucket_request_duration_on_path_bucket{path="/rest",le="0.1",} 39.0
bitbucket_request_duration_on_path_bucket{path="/rest",le="0.25",} 39.0
bitbucket_request_duration_on_path_bucket{path="/rest",le="0.5",} 39.0
bitbucket_request_duration_on_path_bucket{path="/rest",le="0.75",} 41.0
bitbucket_request_duration_on_path_bucket{path="/rest",le="1.0",} 41.0
bitbucket_request_duration_on_path_bucket{path="/rest",le="2.5",} 41.0
bitbucket_request_duration_on_path_bucket{path="/rest",le="5.0",} 42.0
bitbucket_request_duration_on_path_bucket{path="/rest",le="7.5",} 42.0
bitbucket_request_duration_on_path_bucket{path="/rest",le="10.0",} 42.0
bitbucket_request_duration_on_path_bucket{path="/rest",le="+Inf",} 42.0
bitbucket_request_duration_on_path_count{path="/rest",} 42.0
bitbucket_request_duration_on_path_sum{path="/rest",} 5.382160883
We can see that /rest was called 42 times (bitbucket_request_duration_on_path_count). Total execution time is 5.38 seconds ( bitbucket_request_duration_on_path_sum). Also we can see how many web requests are in each bucket (buckets are divided by execution time). For example, 41 requests were executed for less than 1 second and only 1 request were executed for more than 5 seconds.
Why were these metrics collected?
Those metrics were collected because users moved along Jira UI and those moves caused Jira Rest Api to fire. Or users or programs called Jira Rest API directly.
You can see that we can not figure out the exact REST APIs which were called, that is because all urls of web requests are cut to the first level.
For example, let’s say we called http://localhost:2990/jira/rest/api/2/project. http://localhost:2990/jira will be cut because it is the server address and the context and /rest/api/2/project will be left. Then only the first level will be taken which is /rest and set as a label for the metric.
Then same happens with all web requests. Let’s say a user went to cog item -> Manager Apps. In this case http://localhost:2990/jira/plugins/servlet/upm/marketplace/featured?source=side_nav_find_new_addons was called. Again we will cut http://localhost:2990/jira and /plugins/servlet/upm/marketplace/featured?source=side_nav_find_new_addons will be left. We will take the first level which is /plugins and set it as a label.
As the result you will be able to see how much time web requests took for each first level of a url.
This kind of monitoring is available for all Prometheus Exporters except Prometheus Exporter for Bitbucket Lite and Prometheus Exporter for Bamboo.
the PRO way: disable web request monitoring
With the PRO versions you can do the following things.
First of all, you can turn off monitoring of web requests at all. It is a good thing to do if you do not want to monitor web requests. In this case Jira will not spend time on collecting metrics for web requests.
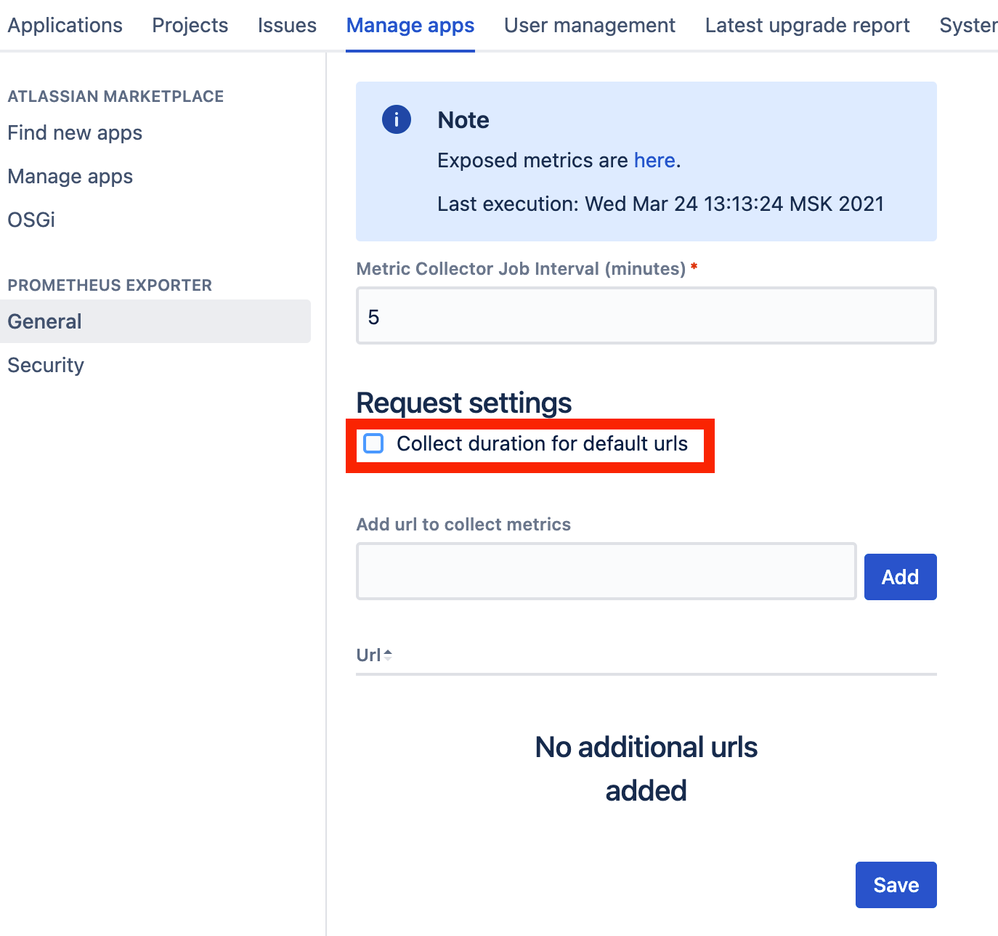
If you want to turn off web request monitoring, go to cog wheel -> Manage Apps -> Prometheus Exporter Settings -> General and uncheck the “Collect duration for default urls” checkbox.
Now no metrics for web requests will not be provided and you save resources of your Jira instance for other actions.
the PRO way: custom urls
The second option is to add your own custom url to monitor. For example, let’s say you want to know how long /rest/api/2/project took. Right now you can see information about the /rest level and you do not know exactly how long /rest/api/2/project took.
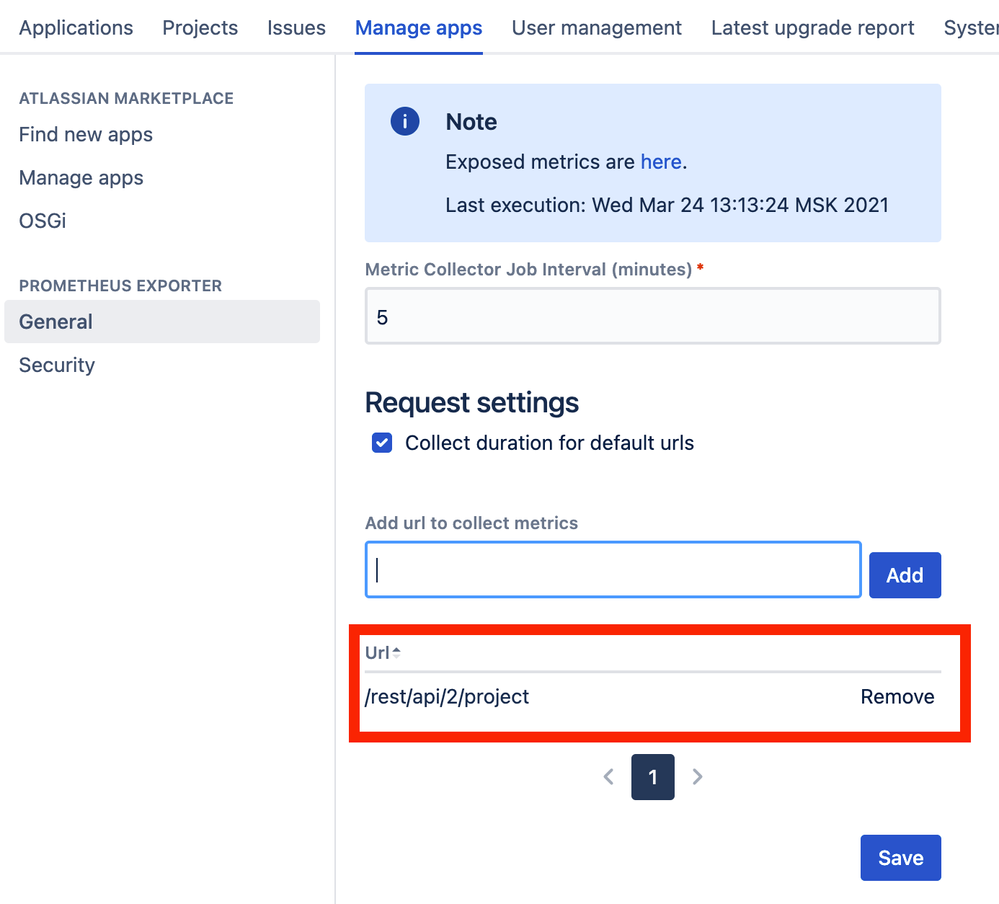
With the PRO versions you can add your custom urls. Go to cog wheel -> Manage Apps -> Prometheus Exporter Settings -> General and add /rest/api/2/project as a new url to collect metrics:
Now if you execute /rest/api/2/project, you will see metrics about this web request:
jira_request_duration_on_path_bucket{path="/rest/api/2/project",le="0.005",} 1.0
jira_request_duration_on_path_bucket{path="/rest/api/2/project",le="0.01",} 1.0
jira_request_duration_on_path_bucket{path="/rest/api/2/project",le="0.025",} 1.0
jira_request_duration_on_path_bucket{path="/rest/api/2/project",le="0.05",} 1.0
jira_request_duration_on_path_bucket{path="/rest/api/2/project",le="0.075",} 1.0
jira_request_duration_on_path_bucket{path="/rest/api/2/project",le="0.1",} 1.0
jira_request_duration_on_path_bucket{path="/rest/api/2/project",le="0.25",} 1.0
jira_request_duration_on_path_bucket{path="/rest/api/2/project",le="0.5",} 1.0
jira_request_duration_on_path_bucket{path="/rest/api/2/project",le="0.75",} 1.0
jira_request_duration_on_path_bucket{path="/rest/api/2/project",le="1.0",} 1.0
jira_request_duration_on_path_bucket{path="/rest/api/2/project",le="2.5",} 1.0
jira_request_duration_on_path_bucket{path="/rest/api/2/project",le="5.0",} 1.0
jira_request_duration_on_path_bucket{path="/rest/api/2/project",le="7.5",} 1.0
jira_request_duration_on_path_bucket{path="/rest/api/2/project",le="10.0",} 1.0
jira_request_duration_on_path_bucket{path="/rest/api/2/project",le="+Inf",} 1.0
jira_request_duration_on_path_count{path="/rest/api/2/project",} 1.0
jira_request_duration_on_path_sum{path="/rest/api/2/project",} 0.003581214
Important thing to know that now the jira_request_duration_on_path_bucket metric with the /rest label will not contain information about /rest/api/2/project. You will be able to see in the /rest label all calls to Jira REST API except /rest/api/2/project.
the PRO way: wildcards
Well. Let’s go further. Suppose you want to know how much time default filters take and how many times users called the default filters.
All default filters have the id less than 0. And when a filter is called from Jira UI there is a filter parameter in url. For example:
http://localhost:2990/jira/browse/TEST-7?filter=-6
http://localhost:2990/jira/issues/?filter=-1
The only common part in the urls above is
filter=-That is why we can add a url like this:
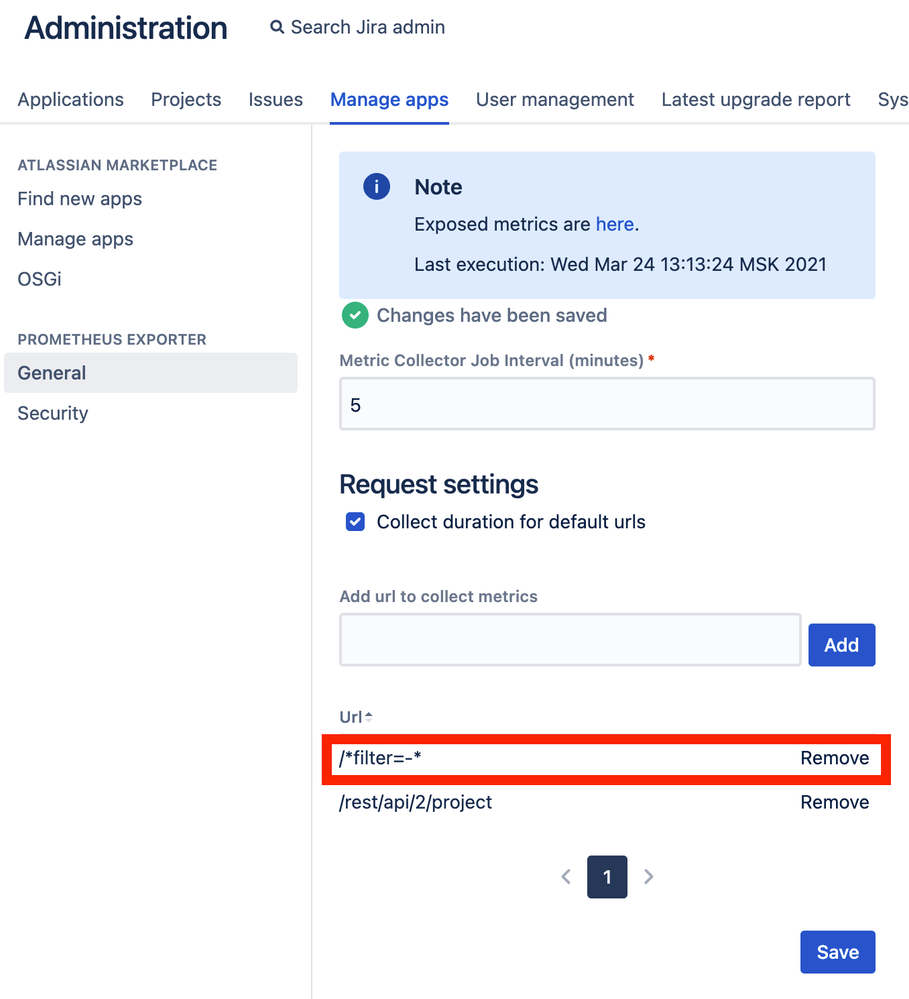
/*filter=-*You can see the asterisk signs at the start and at the end of the url. The asterisk sign means any number of any symbols. It means that the real url may look like this: /issues/?filter=-1, /issues/?filter=-10, /issues/?filter=-3 and so on. You can use the asterisk also in the middle of the url.
Now let’s add the url:
Try to open any out of the box filter and you will see the following metrics:
jira_request_duration_on_path_bucket{path="/*filter=-*",le="0.005",} 0.0
jira_request_duration_on_path_bucket{path="/*filter=-*",le="0.01",} 0.0
jira_request_duration_on_path_bucket{path="/*filter=-*",le="0.025",} 0.0
jira_request_duration_on_path_bucket{path="/*filter=-*",le="0.05",} 0.0
jira_request_duration_on_path_bucket{path="/*filter=-*",le="0.075",} 0.0
jira_request_duration_on_path_bucket{path="/*filter=-*",le="0.1",} 0.0
jira_request_duration_on_path_bucket{path="/*filter=-*",le="0.25",} 0.0
jira_request_duration_on_path_bucket{path="/*filter=-*",le="0.5",} 0.0
jira_request_duration_on_path_bucket{path="/*filter=-*",le="0.75",} 0.0
jira_request_duration_on_path_bucket{path="/*filter=-*",le="1.0",} 0.0
jira_request_duration_on_path_bucket{path="/*filter=-*",le="2.5",} 1.0
jira_request_duration_on_path_bucket{path="/*filter=-*",le="5.0",} 1.0
jira_request_duration_on_path_bucket{path="/*filter=-*",le="7.5",} 1.0
jira_request_duration_on_path_bucket{path="/*filter=-*",le="10.0",} 1.0
jira_request_duration_on_path_bucket{path="/*filter=-*",le="+Inf",} 1.0
jira_request_duration_on_path_count{path="/*filter=-*",} 1.0
jira_request_duration_on_path_sum{path="/*filter=-*",} 1.451636186
Now we can see metrics about default filters.
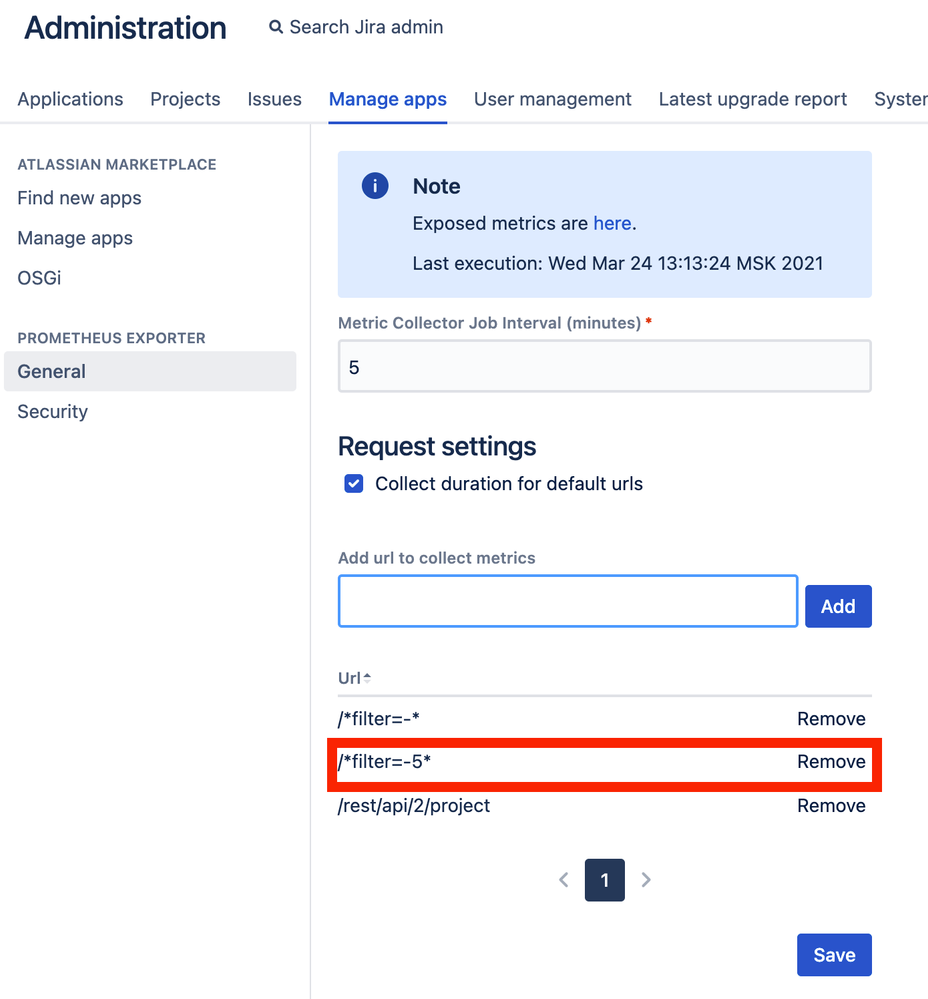
Let’s make our task more complicated. Let’s say we want to monitor the “Open Issues” filter separately. The id of the “Open Issues” filter is -5. That is why we can add a url like this:
/*filter=-5*Now if you call http://localhost:2990/jira/issues/?filter=-5 you can find the following metrics:
jira_request_duration_on_path_bucket{path="/*filter=-5*",le="0.005",} 0.0
jira_request_duration_on_path_bucket{path="/*filter=-5*",le="0.01",} 0.0
jira_request_duration_on_path_bucket{path="/*filter=-5*",le="0.025",} 0.0
jira_request_duration_on_path_bucket{path="/*filter=-5*",le="0.05",} 0.0
jira_request_duration_on_path_bucket{path="/*filter=-5*",le="0.075",} 0.0
jira_request_duration_on_path_bucket{path="/*filter=-5*",le="0.1",} 0.0
jira_request_duration_on_path_bucket{path="/*filter=-5*",le="0.25",} 0.0
jira_request_duration_on_path_bucket{path="/*filter=-5*",le="0.5",} 0.0
jira_request_duration_on_path_bucket{path="/*filter=-5*",le="0.75",} 0.0
jira_request_duration_on_path_bucket{path="/*filter=-5*",le="1.0",} 0.0
jira_request_duration_on_path_bucket{path="/*filter=-5*",le="2.5",} 1.0
jira_request_duration_on_path_bucket{path="/*filter=-5*",le="5.0",} 1.0
jira_request_duration_on_path_bucket{path="/*filter=-5*",le="7.5",} 1.0
jira_request_duration_on_path_bucket{path="/*filter=-5*",le="10.0",} 1.0
jira_request_duration_on_path_bucket{path="/*filter=-5*",le="+Inf",} 1.0
jira_request_duration_on_path_count{path="/*filter=-5*",} 1.0
jira_request_duration_on_path_sum{path="/*filter=-5*",} 1.517880473
Well done.
Now you can ask a question. We executed http://localhost:2990/jira/issues/?filter=-5. It matches both of the url patterns – /*filter=-5* and /*filter=-*. Why was /*filter=-5* chosen. The answer is that the pattern with the longer url will be taken. /*filter=-* has 11 symbols, /*filter=-5* has 12 symbols, that is why /*filter=-5* was taken.
That is all I wanted to tell you about monitoring web requests in Prometheus Exporters. I hope this information will be useful to you.
Was this helpful?
Thanks!
Alexey Matveev

About this author
software developer
MagicButtonLabs
Philippines
1,574 accepted answers
Atlassian Community Events
- FAQ
- Community Guidelines
- About
- Privacy policy
- Notice at Collection
- Terms of use
- © 2024 Atlassian


0 comments