Community resources
Community resources


Master Jira Service Management with customizable reports
Is your support team in the company achieving its objectives? Are requests or incidents responded to with an average first response time of one hour or less? How many new tickets are created on a regular basis? And which issues have not yet been resolved?
Jira IT Service Management (ITSM) helps you address all these questions daily to make the best use of your resources and allow you to adapt services to the requirements of your customers, users, and the company.
In this article, we would like to introduce you two reports that enhance your Jira Service Management with profitable service management features such as key metrics and key activities. Thus, we will not give you inaccurate answers to the above questions, but instead proven facts.
Challenges for IT Service Management
Your ultimate goal is customer satisfaction. To ensure this over the long term, you need a process-oriented management approach that can be tracked transparently. It is impossible to identify performance issues and optimize processes without measuring your metrics.
This is where Jira Service Management steps in to overcome the challenges of ITSM. The collaborative platform provides you with all the features you need for efficient incident, change, and problem management. For example, thanks to a transparent ticketing system, support requests are created and processed quickly on clear dashboards, as you know from Jira software.
The benefits of Jira Service Management
-
Modern ITSM ticket system for tracking support requests
-
Simplified view for your customers
-
Best monitoring of your Service Level Agreements (SLAs)
-
Possibility to connect Jira Cora and Jira Software
-
Comprehensive report types
Measure ITSM success with metrics and reports
The best way to see how effectively your support team resolves submitted requests is through clear metrics and reports. Illustrating your service management metrics (also known as “key performance indicators” or “KPIs”) provides the ultimate “quick win” for your ticketing system. As a result, you can eliminate redundant work, better plan your resources, and maximize team performance.
While Jira Service Management has some standard reports, these do not cover all KPIs. Custom metrics can be addressed through user-defined reports, but this requires quite a bit of resources.
Report Builder by Actonic is an app that extends Jira with several report types. Especially for Jira Service Management, there are exclusive report types that increase the quality of your ITSM immensely. Most of all, reports that visualize key metrics and key activities in an appealing way are a huge asset.
In this step-by-step guide, we will introduce you to two such reports from Report Builder:
How to use Service Management: Key metrics
One of the most important key metrics of a good Jira Service Management is certainly the number of tickets over the last days and the median first response time. The Service Management: Key metrics report type displays both metrics.
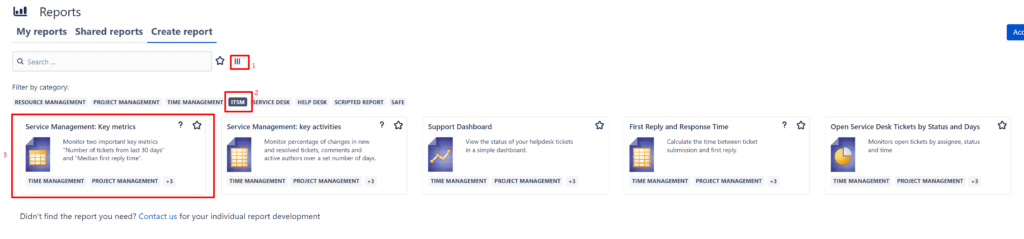
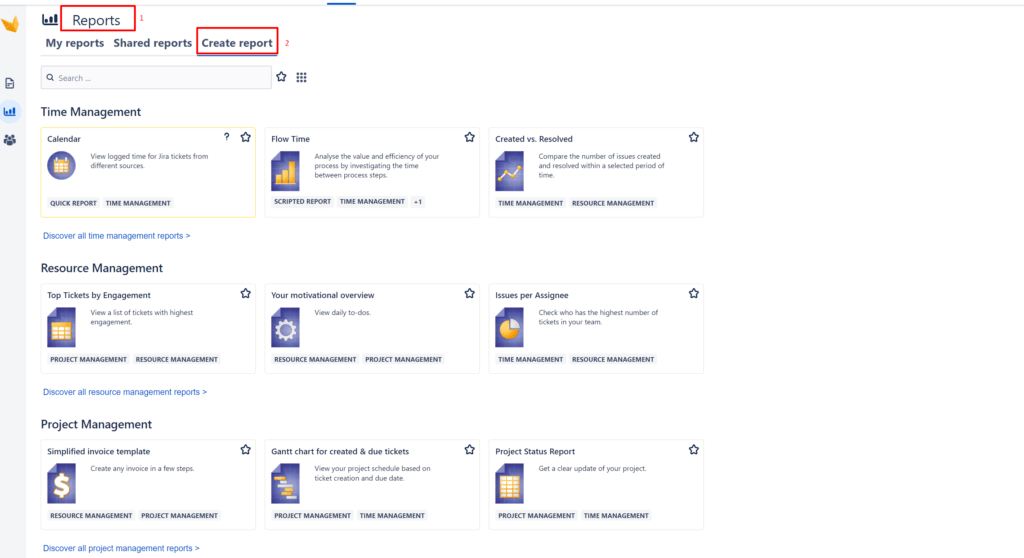
Step 1: To create the report on key metrics, first navigate to “Reports” and select “Create report” from the bar.
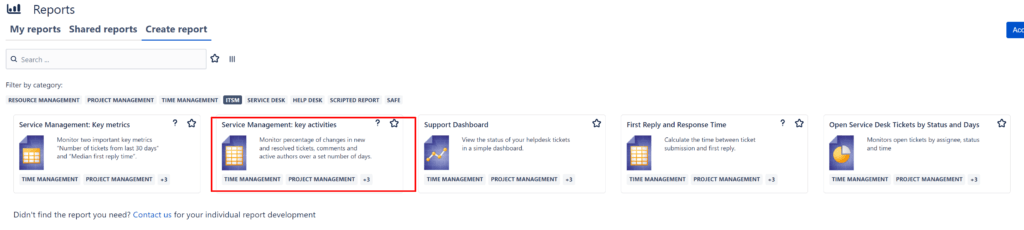
Step 2: After changing the view (1), select the Quick Filter “ITSM” (2) and click on the report.
Step 3: At the beginning, the empty start page shows up with the request to select a project or a filter.
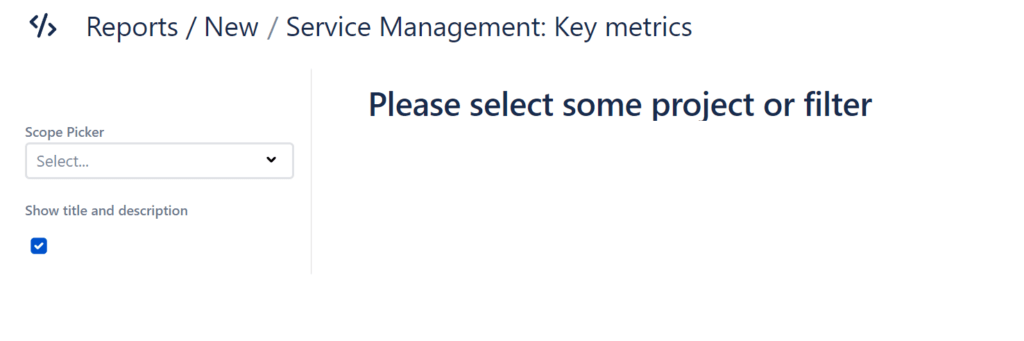
Step 4: With the Scope Picker, you can conveniently switch between “JQL” and a “basic view”. Just as it suits your needs.

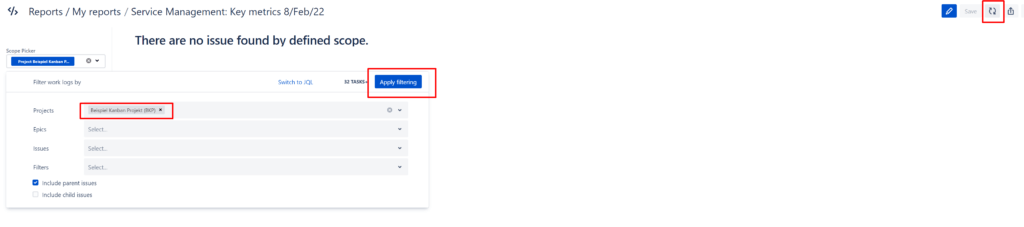
Step 5: In our example, we choose the “basic view” and can now set all filters like Projects, Epics, or Issues. Click on “Apply filtering” and then on the “refresh button” to view your results. Multiple selections are possible for all filters.
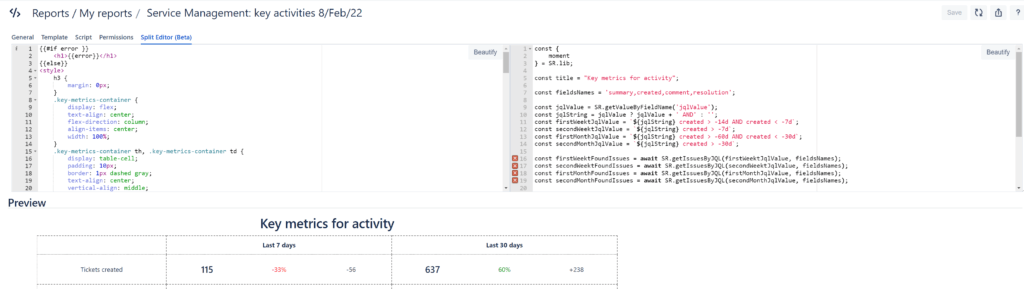
Step 6: As a result, you can now see how many tickets were created within the last 30 days. The comparison to the previous month is also shown as a percentage. In addition, the median first reply time is displayed.

How to measure key activities
Key activities are the most important actions your support team needs to complete in order to be successful. In ITSM, this is certainly the creation and resolution of support tickets. The Report Builder report type Service Management: Key activities is particularly suitable for this. It allows you to monitor the percentage of changes in new and resolved tickets, comments, and active authors over a certain number of days.
How to use the ITSM report:
Step 1: Follow the steps just described to navigate to the report.
Step 2: After changing the view (1), select the Quick Filter “ITSM” (2) and then the Key activities report.
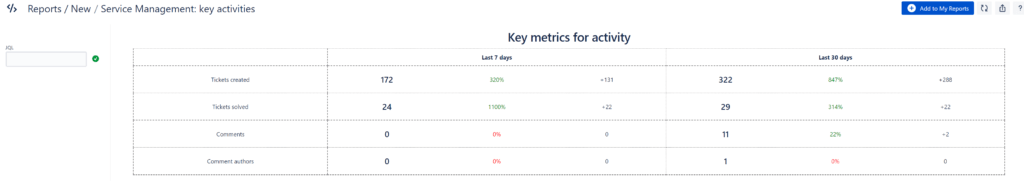
Step 3: By default, the tickets of the last 30 days are displayed, whereas the tickets of the last seven days are marked separately. Here you have the columns: created and completed tickets, as well as comments and their authors. Percentages in green or red show you at a glance whether the activities have improved or gotten worse.
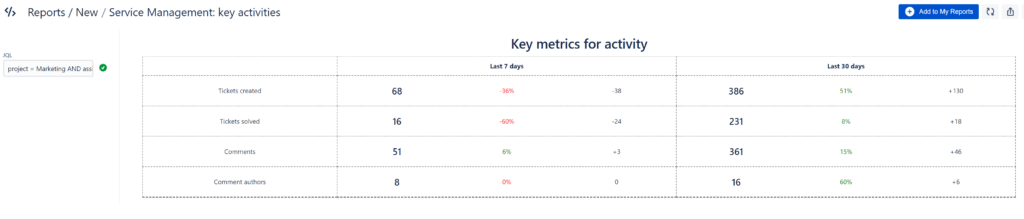
Step 4: Of course, you can use JQL to make further specifications. For comparison, we have also once entered the command: “project = Marketing AND assignee is not EMPTY” and get this result afterwards:
High level with Scripted Reports
Both Report Builder report types presented are scripted reports. This means that once the reports have been created, you can use HTML and JavaScript to post-process your reports individually. For example, change the display from table to bar chart or pie chart. You can also customize access permissions here.
After configuration, you can save the report, share it with others or export it to Excel, CSV or PDF.
Quick win for your Jira Service Management
Using the Report Builder reports Service Management: Key metrics and Service Management: Key activities is a clear win for your service management in Jira. With their help, you monitor the performance of your Service Level Agreements in a way that is transparent to the whole team. The reports created can be customized according to your needs and are perfect for presenting to your stakeholders as well.
You can’t improve what you don’t measure. Therefore, implementing Report Builder for your Jira Service Management is worth it in any case.
Was this helpful?
Thanks!
Andreas Springer _Actonic_

About this author
Head of Marketing
Actonic GmbH
Germany
2 accepted answers
Atlassian Community Events
- FAQ
- Community Guidelines
- About
- Privacy policy
- Notice at Collection
- Terms of use
- © 2024 Atlassian
0 comments