Community resources
Community resources
- Community
- Products
- Jira Software
- Questions
- Lots of JS errors in Jira during issue preview
Lots of JS errors in Jira during issue preview
I've been experiencing some intermittent degraded functionality when using Jira lately and am wondering if its some combination of chrome plugins or just my bad luck.
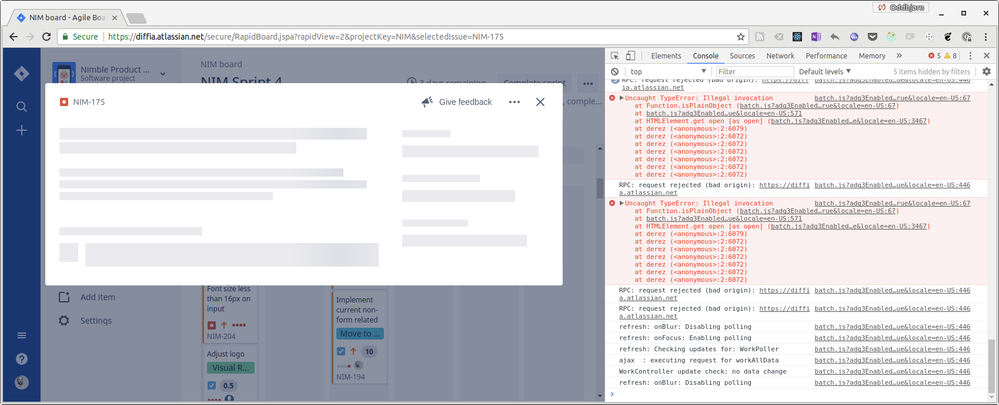
When I click on a case in my Jira board and the preview window opens, it stays "greyed out" (loading). The following JS errors appear in the console:
Uncaught TypeError: Illegal invocation
at Function.isPlainObject
There are also a lot of the following:
RPC: request rejected (bad origin) ...
The issues seem to stay for a couple days, and then go away, and then come back, etc. I've cleared application cache for the domain numerous times, it doesn't seem to have a clear impact.
3 answers
I am experiencing this as well. One weird thing I've observed is that the issue preview content initially never appears, but if I resize the window the content appears along with a load of errors in the console. I have tried reloading, disabling cache, logging out and in again, but to no avail. Opening the JIRA instance in a Chrome incognito windows works, however.
Simply by temporarily disabling my Redux DevTools extension seems to fix the issue. (Though curiously, re-enabling it again everything seems fine - at least for a while)
If it works in incognito it may indicate some extension is causing issues.
You must be a registered user to add a comment. If you've already registered, sign in. Otherwise, register and sign in.
Disabling the redux extensions works for me too. Using the whitelisting option in redux extension to not include JIRA does not work. The extension must not be present at all (disabled) and then I have to reload the page. So, my guess is the hook the extension places in the page is causing the issue. If you enable the extension later the hook does get engaged so it works. Must be something non-standard with the way the redux actions are being used since many sites use redux and this is the only one that has an issue with the extension that I know of.
You must be a registered user to add a comment. If you've already registered, sign in. Otherwise, register and sign in.
Also happening for us, but only for some users. Persisted through log out/log in.
Sorry for posting, didn't see that this wasn't a normal message board, but a StackOverflow like QA thing. That was supposed to be a comment.
You must be a registered user to add a comment. If you've already registered, sign in. Otherwise, register and sign in.

Hi Joel, are you using cloud or server?
You must be a registered user to add a comment. If you've already registered, sign in. Otherwise, register and sign in.
You must be a registered user to add a comment. If you've already registered, sign in. Otherwise, register and sign in.

Ok, are you on a corporate network that uses some kind of cache or proxy?
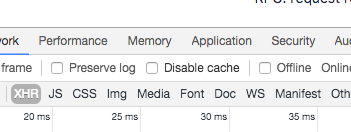
Can you try by disabling the browsers cache? in chrome you can find it here:
Hope it helps
You must be a registered user to add a comment. If you've already registered, sign in. Otherwise, register and sign in.
Yeah i'm on a corporate network, but i recall the issue happening at home as well. Caching is disabled.
I disabled all extensions and the problem went away. Then I re-enabled all my extensions and the problem... still went away. Something screwy is going on with my browser.
You must be a registered user to add a comment. If you've already registered, sign in. Otherwise, register and sign in.
@Joel Collins The disable/enable extension thing is consistent with what @skube writes in a comment above as well. I'll try that as well.
You must be a registered user to add a comment. If you've already registered, sign in. Otherwise, register and sign in.

Was this helpful?
Thanks!
TAGS
Community showcase
Atlassian Community Events
- FAQ
- Community Guidelines
- About
- Privacy policy
- Notice at Collection
- Terms of use
- © 2024 Atlassian


You must be a registered user to add a comment. If you've already registered, sign in. Otherwise, register and sign in.