Community resources
Community resources
- Community
- Products
- Jira Software
- Questions
- JIRA Chart with total number of open bugs over time?
JIRA Chart with total number of open bugs over time?

I am looking for a way to chart number of unresolved JIRA issues over time.
It should display something like

That's the total number of open bugs, not bugs created during the specified period of time.
This should allow us to see if the number of open-bugs is growing over time.
19 answers
Atlassian,
Your issue tracking product can't show me my bug trend. That bears repeating: Your issue tracking product can't show a bug trend. Say those exact words to your VP of Product and hopefully the ludicrousness of it will motivate them to get this done.
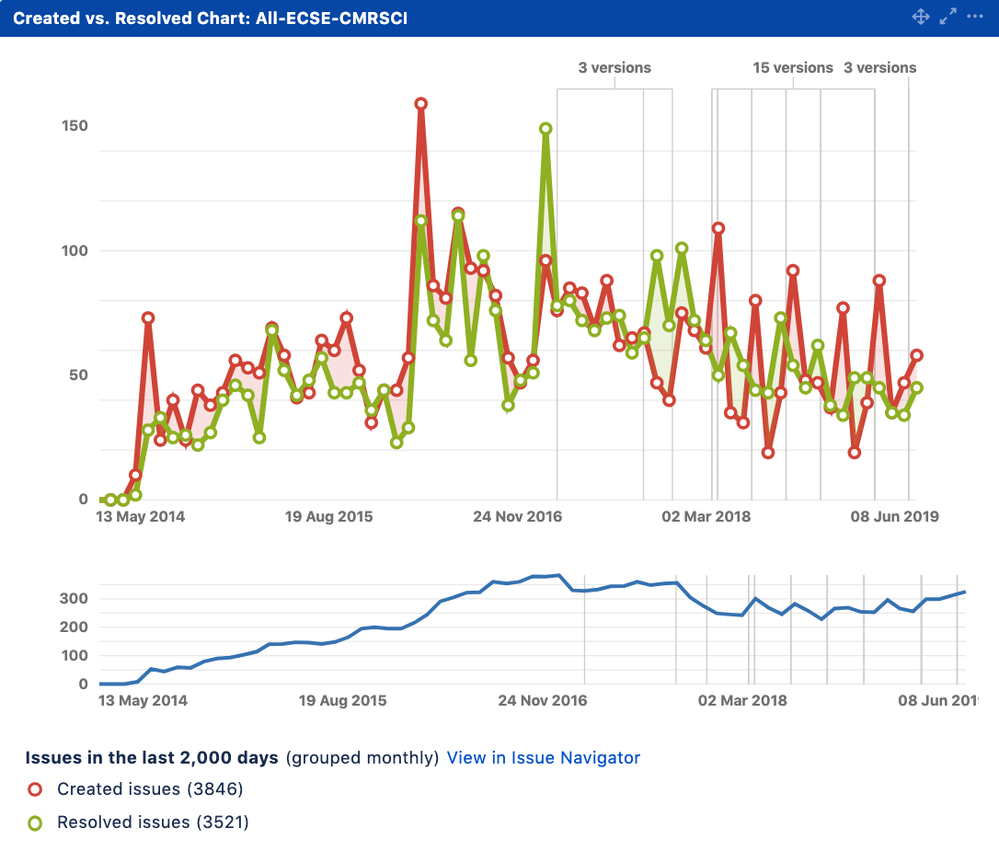
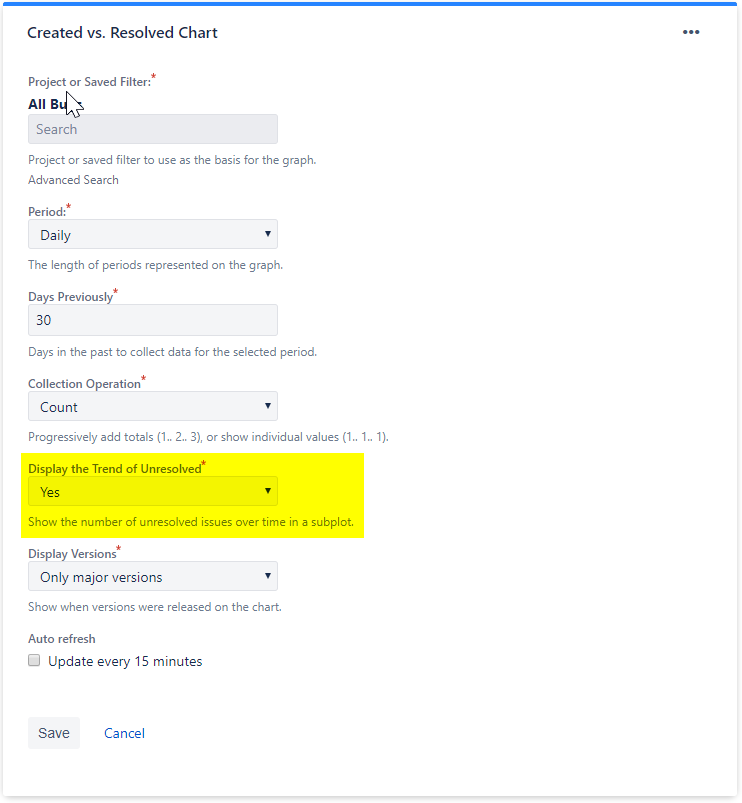
I have my own Dashboard and on it I added the Created vs Resolved Chart gadget. I created a filter that included the two projects that I manage. I added the filter to the gadget. For Days Previously I selected a big number of days way before the start date of my projects (2000) in my case. Select yes for Display the trend of Unresolved. Once I save the gadget, this is what it looked like. If you look at the bottom the trend graph is what you all may be looking for.
You must be a registered user to add a comment. If you've already registered, sign in. Otherwise, register and sign in.
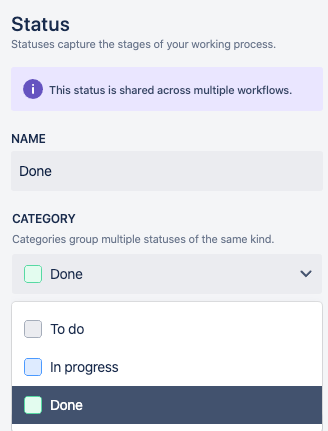
We have a "next-gen project" and our closed tickets are marked as "Done" instead of "Resolved" so the chart above reports 0 resolved tickets across the time period. Anyone have a fix for that?
You must be a registered user to add a comment. If you've already registered, sign in. Otherwise, register and sign in.
Afaik, the charts in question are not based on the "Status" field.
What they can target is the "Resolution" field.
In most workflows I have worked on, transitioning to specific Status (e.g. Resolved / Closed) will trigger a change of the Resolution from "Unresolved" to "Resolved".
While this approach may not correctly show the historic trend, it may help to generate such a trend in the future.
In any case, I would suggest checking your workflow with your Jira admin.
You must be a registered user to add a comment. If you've already registered, sign in. Otherwise, register and sign in.
Atlassian
Can we please get a response here? This would be a really useful tool.
You must be a registered user to add a comment. If you've already registered, sign in. Otherwise, register and sign in.
You won't get this from Jira.
I've Googled for the solution and came here.
I decided to make my own solution which you can use as well.
Notice the "Average age" report has a "Data Table" at the bottom, with a period for each row and number of issues unresolved? This is the exact data set you need ( I believe ).
Simple filter what you need using this report, and then copy the data here into Excel and create your own chart.
A bit annoying, but gets the job done in about 2 minutes.
You must be a registered user to add a comment. If you've already registered, sign in. Otherwise, register and sign in.
The Average Age Report, when generated from the All Reports section, features a count of Unresolved Issues.
Annoyingly, this count is not shown directly in the chart (and afaik cannot be configured to do so). It is, however, visible in the Data Table below.
If this suits your needs, I recommend creating a filter that shows all your bugs and creating the report mentioned above to use the numbers from the Data Table.
It is possible to adjust the time frame to show daily counts instead.

You must be a registered user to add a comment. If you've already registered, sign in. Otherwise, register and sign in.
I also want this and having a hard time with existing gadget to build a trend view. Jira folks - can you please groom your backlog
You must be a registered user to add a comment. If you've already registered, sign in. Otherwise, register and sign in.
I would also really, really like this feature. I can't believe its not there! I simply want number of open issues (y axis) vs time (in weeks or months or quarters) on the x axis.
Mantis bug tracker does this nicely.
You must be a registered user to add a comment. If you've already registered, sign in. Otherwise, register and sign in.
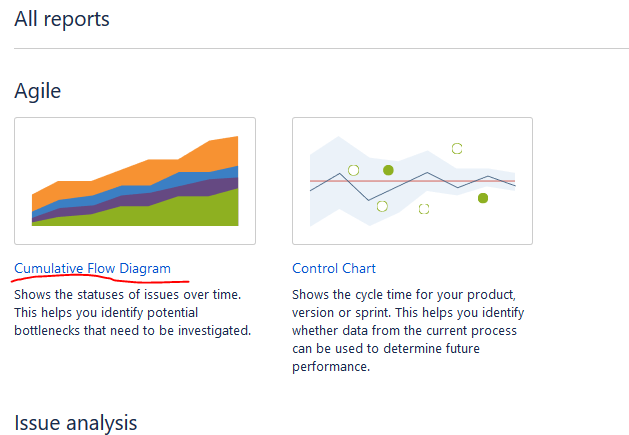
Have you tried Cumulative Flow Diagram? This report seems to do a decent job of giving # of unresolved issues over time. It's not perfect, since it gives extra detail about the state of the issues, but when you look at the chart over time, I believe it will do what most of folks here are looking for. It won't give you a per user graphic, however.
Make sure that when use Cumulative Flow Diagram, you click on "Refine report" and then unclick on the Resolved/Done/Closed issues. This will ensure that it will only take into account the unresolved issues.
You must be a registered user to add a comment. If you've already registered, sign in. Otherwise, register and sign in.
I need exactly the same thing. Attalasian has two answers they will supply over an over
Neither do what you need/want. Your chart shows it perfectly, in case there is any confusion, here is the raw data needed.
Date - Total Active Bugs
Apr/1/14 - 25
Apr/2/14 - 22
Apr/3/14 - 19
Apr/4/14 - 14
Apr/5/14 - 26
Apr/6/14 - 20
Apr/7/14 - 15
You must be a registered user to add a comment. If you've already registered, sign in. Otherwise, register and sign in.
Here is the feature request created 12/Mar/08, its been around 6 years with little activity...
You must be a registered user to add a comment. If you've already registered, sign in. Otherwise, register and sign in.
You must be a registered user to add a comment. If you've already registered, sign in. Otherwise, register and sign in.
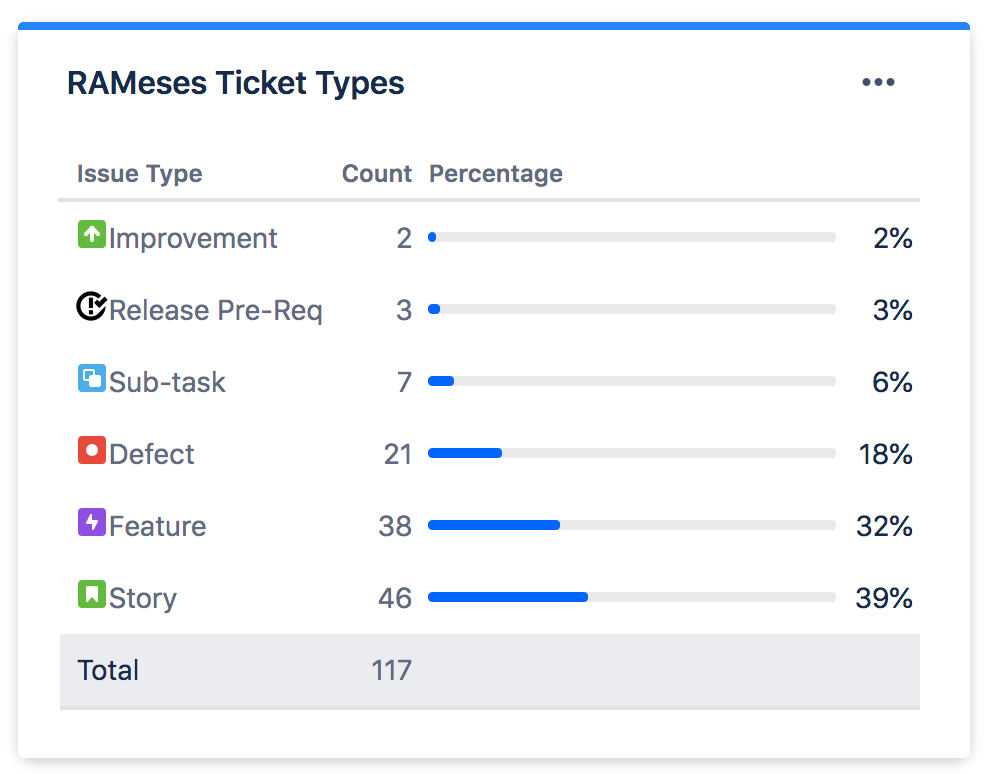
Dear Sneha,
You need to use "Issue Statistics" gadget for getting the above view. Use Issue type for selecting statistics type for display.
You must be a registered user to add a comment. If you've already registered, sign in. Otherwise, register and sign in.
Hello Everyone,
Did anyone heard of an improvement regarding this issue ?
I have lost a tremendous amount of time trying to overcome the limits of the reporting tools offered by Jira.
I am bounded to extract daily the total number of issues to create an excel diagram of my own for my team (not very agile ...)
Kind regards
You must be a registered user to add a comment. If you've already registered, sign in. Otherwise, register and sign in.
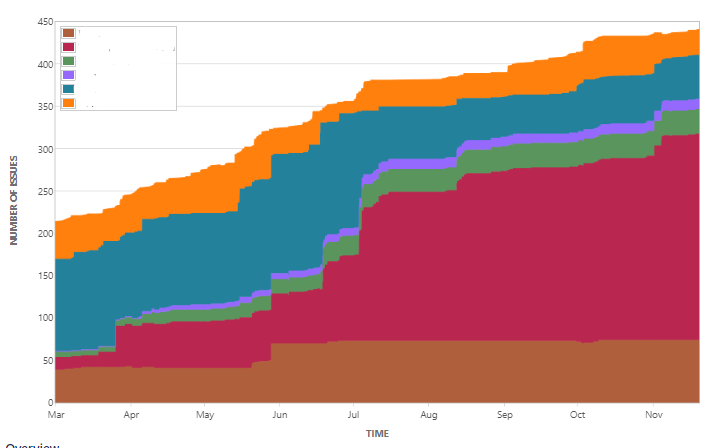
I am currently using the Cumulative Flow Diagram inside the project report section. Based on a board that is based on a search for bugs.
This way I see all bugs reported cumulative and is able to determine when we find less bugs/time.
I am also able to make several boards for different types of bugs to see what severity level issues being found. This way I am able to determine the quality of the product /project and we are able to make decisions on release and beta status.
Not a real life example picture attached:
Did anyone find a better way?
You must be a registered user to add a comment. If you've already registered, sign in. Otherwise, register and sign in.
I need this as well .. it is insane that this is not a standard gadget for the dashboard. :/
You must be a registered user to add a comment. If you've already registered, sign in. Otherwise, register and sign in.
I need this exact information presented on a wallboard for the project management community. Where the hell is it, and if its not there, why the hell not?
You must be a registered user to add a comment. If you've already registered, sign in. Otherwise, register and sign in.
Hi Edward,
Did you try to make a board and a Cumulative Flow Diagram in the reports area inside a project. It might be visible in a wallboard (personally I don't use wallbords yet).
You must be a registered user to add a comment. If you've already registered, sign in. Otherwise, register and sign in.
I have a script that pulls from JIRA using the API. I have a walk back script that sets the state of a defect on a particular date, producing a table of states over time. I then chart it. I get a really good view of defects over time in Excel. I can see if I'm burning up/burning down over time overall, and by defect priority. If this would be useful to anyone I can post something to Github.
You must be a registered user to add a comment. If you've already registered, sign in. Otherwise, register and sign in.
I'm interested too. I've been trying to do something similar using the Jira.JQL() add-on for Excel but I still haven't figured out how to search over time.
You must be a registered user to add a comment. If you've already registered, sign in. Otherwise, register and sign in.
Just piling on. I'm also surprised that they haven't addressed the problem. I'm also new to Jira and from my limited time using the tool, it's clear they don't care about their ux/ui.
You must be a registered user to add a comment. If you've already registered, sign in. Otherwise, register and sign in.
So I think I solved my issue in Confluence. (Good enough)
--> I made a page and inserted a (+)Jira issue/filter,
click on Jira charts,
insert a search or filter in the search field of what to display,
chose Created VS resolved,
and in the display options check in Comulative Totals.
But you need Confluence to be installed. EDIT: this is working in the Jira Dashboard as well.
You must be a registered user to add a comment. If you've already registered, sign in. Otherwise, register and sign in.
Yes, I need it as well. I'm amazed it's no way to do this basic task. Is it because it's not an accepted agile form of presentation. Or is it another software to buy to make diagrams. Available ones do not meet my expectations. (I recently started to work in Jira)
You must be a registered user to add a comment. If you've already registered, sign in. Otherwise, register and sign in.
I would love to see this feature as well. Currently I'm trying to show a "per user total issues by time" line chart? That means the same as your graphic, but every line should be a user instead of a project. Example: Day 1 (x axis) Tom has 3 issues (y axis, red line), Brendan 0 (y axis, blue line). Day 2 Tom has 1 issue (red), Brendan 1 (blue)
You must be a registered user to add a comment. If you've already registered, sign in. Otherwise, register and sign in.
I am also looking for the same.. How to we track the number of open bugs in JIRA? Please advise if any of you know how to do it ... Thank you Suren
You must be a registered user to add a comment. If you've already registered, sign in. Otherwise, register and sign in.

Was this helpful?
Thanks!
TAGS
Community showcase
Atlassian Community Events
- FAQ
- Community Guidelines
- About
- Privacy policy
- Notice at Collection
- Terms of use
- © 2024 Atlassian




You must be a registered user to add a comment. If you've already registered, sign in. Otherwise, register and sign in.