Community resources
Community resources
- Community
- Products
- Jira Software
- Questions
- Database monitoring Connection Pool graph
Database monitoring Connection Pool graph
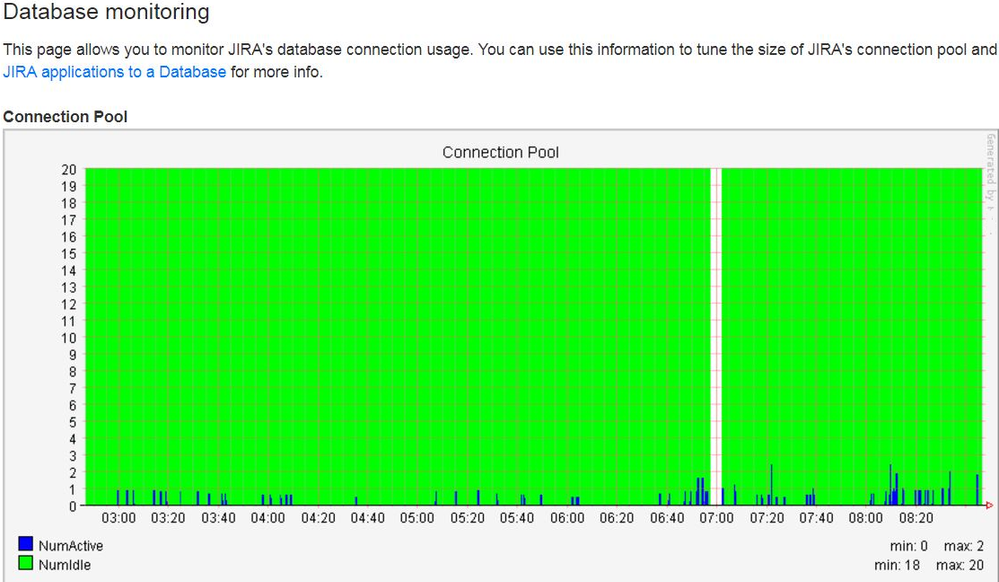
What does it mean when there is a white space between the graph reporting? Occasionally Jira becomes unresponsive, would that whitespace be because jira isnt running so it isnt reporting? Is there something in a log file that I should be keyword searching for?
Any input is greatly appreciated.
2 answers
1 accepted

Hi,
I only see this white spots spaces the application is down
I have a similar problem! but I'm sure that application was NOT down! Any other thoughts? Of course we are having high memory usage and very poor performance
You must be a registered user to add a comment. If you've already registered, sign in. Otherwise, register and sign in.

Saba,
If you don't see any green or blue it means that there are no idle or active connections.
It is a weird condition but this can happen, maybe you can submit a formal ticket to atlassian support to get an answer.
Do you have any clue about what causes your performance issues? Maybe we can help you with that
You must be a registered user to add a comment. If you've already registered, sign in. Otherwise, register and sign in.
For us, when the java garbage collection ran it killed the app which introduced that blank in the graph. We resolved it by modifying the jira service with the following options to reduce the pause of locking Jira.
-XX:+UseG1GC -XX:MaxGCPauseMillis=300
I agree support will be better to assist you but id check your gc logs to see if there are long pauses which would make Jira unusable during the lock.
@Saba
You must be a registered user to add a comment. If you've already registered, sign in. Otherwise, register and sign in.
I'm not sure what's our issue but memory usage is high and get a lot of errors like this:
org.apache.catalina.connector.ClientAbortException: java.io.IOException: An existing connection was forcibly closed by the remote host] with root cause
java.io.IOException: An existing connection was forcibly closed by the remote host
You must be a registered user to add a comment. If you've already registered, sign in. Otherwise, register and sign in.

Peter P,
Thanks for the Tip, i will try this!!
You must be a registered user to add a comment. If you've already registered, sign in. Otherwise, register and sign in.

Saba,
Check this doc for tuning connections:
https://confluence.atlassian.com/adminjiraserver071/tuning-database-connections-802592189.html
Check if your setup is ok according to the doc
You must be a registered user to add a comment. If you've already registered, sign in. Otherwise, register and sign in.
Hi,
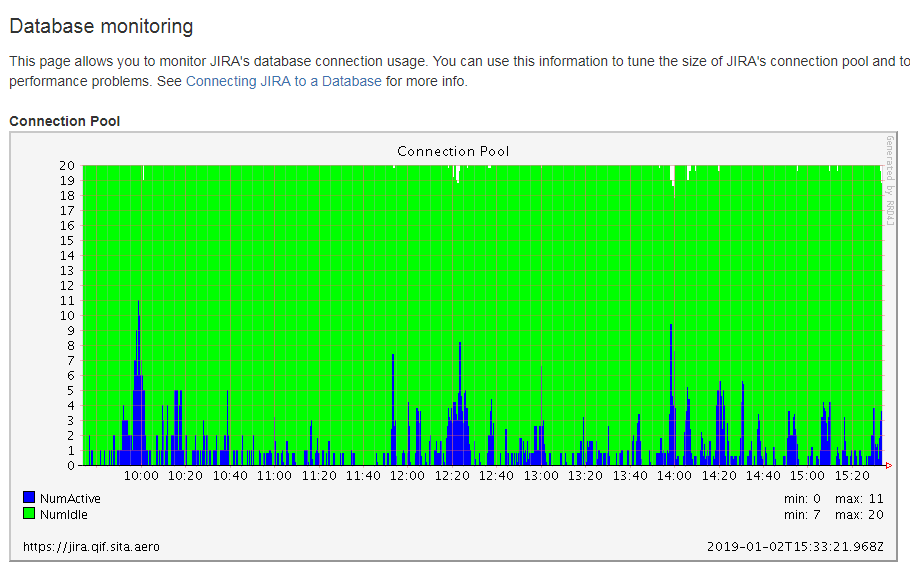
Facing similar issue with lot of below warnings, is it like this due to pool exhaustion or just the all the connections are active.
Any help would be highly appreciated as this in our JIRA production and impacting all the users.
2018-12-26 10:02:15,504 http-nio-8080-exec-191 WARN skaushik1 602x11003971x7 y89vns 57.5.115.247,10.231.8.27 /secure/admin/ViewSystemInfo.jspa [c.a.jira.ofbiz.ConnectionPoolHealthSqlInterceptor] Dangerous use of multiple connections: taken => count=2; marks=[1-0]; pool=20/20
2018-12-26 10:02:15,505 http-nio-8080-exec-191 WARN skaushik1 602x11003971x7 y89vns 57.5.115.247,10.231.8.27 /secure/admin/ViewSystemInfo.jspa [c.a.jira.ofbiz.ConnectionPoolHealthSqlInterceptor] Dangerous use of multiple connections: replaced => count=1; marks=[0-0]; pool=19/20
You must be a registered user to add a comment. If you've already registered, sign in. Otherwise, register and sign in.

Was this helpful?
Thanks!
Community showcase
Atlassian Community Events
- FAQ
- Community Guidelines
- About
- Privacy policy
- Notice at Collection
- Terms of use
- © 2024 Atlassian


You must be a registered user to add a comment. If you've already registered, sign in. Otherwise, register and sign in.