Community resources
Community resources
- Community
- Products
- Jira Software
- Questions
- Control chart mixing historic and current data due to bulk change - ideas for what to do?
Control chart mixing historic and current data due to bulk change - ideas for what to do?
I regularly look at the control chart to see how our cycle times for reacting to and fixing problems are changing.
When I was looking at our recent data, I saw lots of issues placed on the chart which had been resolved years ago if you look at the resolutiondate, but which were recently updated due to a bulk change.
This bulk change was intended to change the priority, but seems to have updated the status (without changing it?) if we look at the history:
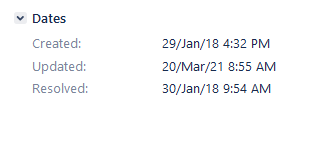
As you can see, the resolution date on the issue is still as it was:
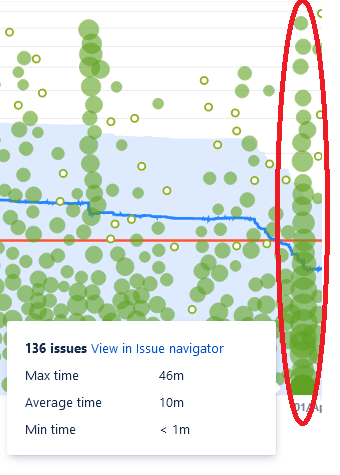
And yet it appears in the red circle on the control chart, along with many other issues, making the control chart much less useful as historic and current data are all mixed up.
I guess the control chart places issues on the x-axis according to when the issue transitioned to the relevant status/column on the board and not resolutiondate, which obviously makes sense, otherwise you could not see process times for steps happening before resolution. However, this is now an annoying situation - is there anything I can do to correct it or do we need to suck it up? :)
2 answers

Hi @Paul Isaacs -- Welcome to the Atlassian Community!
How about this work-around: Create a quick filter for the board which checks for resolution data after some reasonable time-frame.
resolutiondate > -100d
When you run the report, select that filter to exclude the older stuff.
Update: I just re-read your question and indeed if the status has changed, I think you are stuck with the later dates.
What you can do depends upon your status workflow...If you have a status close to done, but which is not done (e.g. Releasing) you could change your measurement boundary to that point.
Best regards,
Bill
Hello @Paul Isaacs ,
For a ready built solution that offers great flexibility and details, our team at OBSS built Time in Status. It provides more fexible and detailed reports compared to Control Charts and it won't be affected by such bulk updates. It is available for Jira Server, Cloud and Data Center.
Time in Status mainly allows you to see how much time each issue spent on each status or assigned to each assignee. You can combine statuses in any way into consolidated columns to see metrics like Ticket Age, Cycle Time or Lead Time. You can calculate averages and sums of those durations grouped by issue fields you select. (For example see the total InProgress time per Epic, or average resolution time per issuetype). You can even group by Story points as your group by field to group averages by similar sized issues

Time in Status can display its data and charts in its own reporting page, Jira dashboards and issue view screens.
The app calculates its reports using already existing Jira issue histories so when you install the app, you don't need to add anything to your issue workflows and you can get reports on your past issues as well.
Using Time in Status you can:
- See how much time each issue spent on each status, assignee, user group and also see dates of status transitions. Sort and Filter according to report values.
- Calculate averages and sums of those durations grouped by issue fields you select. (For example see average InProgress time per project and per issuetype.)
- Export your data as XLS, XLSX or CSV.
- Access data via REST API. (for integrations)
- Visualize data with various chart types.
- See Time in Status reports on Jira Dashboard gadgets (released for cloud, server&DC gadget coming soon)
https://marketplace.atlassian.com/1211756
EmreT
You must be a registered user to add a comment. If you've already registered, sign in. Otherwise, register and sign in.

Was this helpful?
Thanks!
TAGS
Community showcase
Atlassian Community Events
- FAQ
- Community Guidelines
- About
- Privacy policy
- Notice at Collection
- Terms of use
- © 2024 Atlassian


You must be a registered user to add a comment. If you've already registered, sign in. Otherwise, register and sign in.