Community resources
Community resources
- Community
- Products
- Jira Software
- Questions
- Best Way to monitor JIRA Database access and usage
Best Way to monitor JIRA Database access and usage
I would like to know the proper way to monitor and identify when/how JIRA is under high-stress /demand
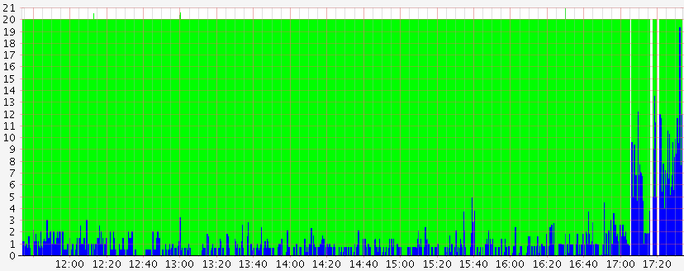
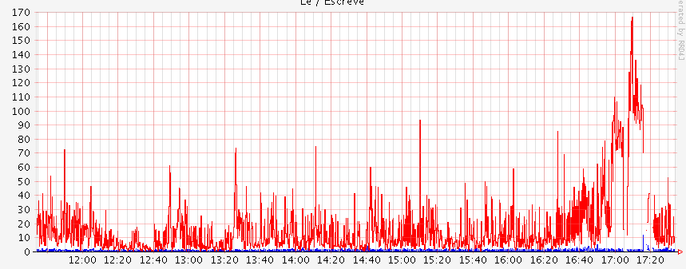
I normally use the Database Monitoring page, and while I can identify the patterns, I can't get the exact times from the graphs to try and cross them with the logs and see what caused the hiccups.
To be more specific, recently we have been having some "hiccups" in our JIRA server, and on checking the monitor graphs, they happen when we have high demand on the Connections Pools and Read/Write graphs, the server monitor also indicates high loads and memory use.
What I want to know is:
1-How to get the specific times of the high loads and the "hiccups"(?) indicated by the white columns on the graphs.
2-How do I check on the logs what is causing this, any guidelines on what I should look for?
We suspect someone is making a heavy API request, but currently have no evidence.
Thanks,
0 answers
TAGS
Community showcase
Atlassian Community Events
- FAQ
- Community Guidelines
- About
- Privacy policy
- Notice at Collection
- Terms of use
- © 2024 Atlassian


