Community resources
Community resources
- Community
- Products
- Jira Software
- Questions
- Experiencing "Activity Stream" is dead very frequently
Experiencing "Activity Stream" is dead very frequently
Hello there,
We are running JIRA Server, since last month we are experiencing very very frequently ACTIVITY STREAM is dead on the dashboards. Every time we have to restart the instance service to get it back working and it goes off again within few hours or sometimes within few days.
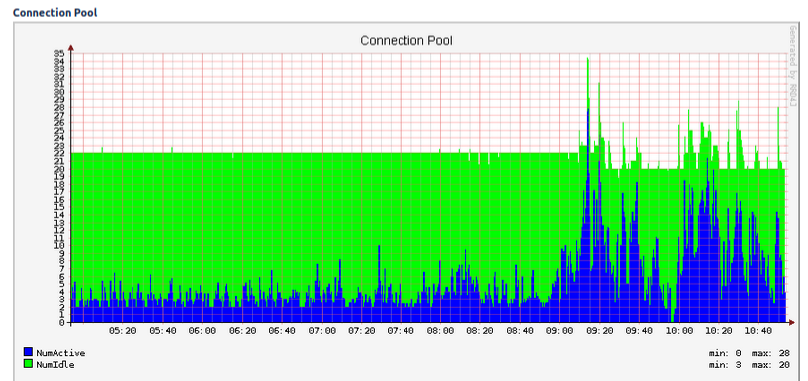
Even experiencing high spikes in the DB connection graph, please find attached screenshot of the DB connection graph.
Please help us to resolve these issues ASAP.
Regards,
Sami Ahmed Shaik.
1 answer

Hi Sami,
from my own experience this is a cascade of issues you are currently facing.
The missing activity stream mostly is a symptom of all of it - not the cause.
The blue spikes in database connections suggest there is something that is requesting data from database frequently. There is no easy button to push - it requires (mostly lengthy) debug from log files.
Like said in the beginning, there are situation where also this problem is just a cause of something bigger.
A good understanding of your system, your configuration and user usage pattern is needed - which we don't have here.
Many good information is to be found from Atlassian knowledge base.
https://confluence.atlassian.com/jirakb/troubleshoot-performance-issues-in-jira-server-336169888.html
At first I'd check
- have there been updates lately?
- if the hardware healthy?
- has there been something changed on system level lately?
- have I checked log files? What do they show?
- what is causing load to the database?
- Who are my users and how do they request data from database?
- did we introduce new Apps lately? Have we checked change records?
- do we assign enough memory to our instance? Do we need more? Do we have too much? Do we see Out of Memory errors?
- did we tune garbage collection? If so, why? Are values from log healthy?
- Do we have a heap dump, thread dump of a time this happened?
- Did we check with profiling?
- Is Health Check reporting back something unsual?
- Did we check with support of external tools (earliest when the above topics are checked)?
This list can be extended to nearly infinity so please consider this only as a very rough guideline.
Cheers,
Daniel

Was this helpful?
Thanks!
DEPLOYMENT TYPE
SERVERVERSION
8.5.5Community showcase
Atlassian Community Events
- FAQ
- Community Guidelines
- About
- Privacy policy
- Notice at Collection
- Terms of use
- © 2024 Atlassian


You must be a registered user to add a comment. If you've already registered, sign in. Otherwise, register and sign in.