Community resources
Community resources
- Community
- Products
- Jira Service Management
- Questions
- Dashboard - Issues closed per month and per agent
Dashboard - Issues closed per month and per agent
Hi team,
I would like to know if there is a dashboard to display the number of issues closed by months and per assignees or per clients within the same dashboard ?
When I am using Recently Created Chart Gadget and when I am clicking on the graph to see the query is taking into account: AND created >= 2020-08-01 AND created <= "2020-08-31 23:59" which I would like to delete.
- Can you let me know if there is a way to modify the JQL query within the dashboard ?
- Do you know any gadget to display more than 2 dimensional filters ?
Thanks,
Ben
1 answer
Hello @bsimon ,
You hvae a few options here and I believe the Created Vs Resolved gadget might be what you are looking for for the easiest and quickest setup option, there is an older but still relevant Blog post viewable at the following link that goes into detail on the gadget's functionality and uses cases:
But per the requirements, you noted I would say create a new saved filter per user that you wanted to track on the dashboard and then add a created vs resolved gadget for each saved filter, with a monthly interval.
Next, you asked if there is a way to modify the JQL query within the dashboard. In this case, no, you would first want to modify the saved filter from the issue navigator if you are the filter owner, or create a new saved filter, then modify the dashboard gadget to point to the new filter. See "Manage shared items" for filter and dashboard sharing and ownership details.
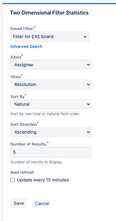
Then for the Two Dimensional filter-statistic gadget, you could look at adding in Assignee as the X-Axis and Resolution as the Y-Axis like the following screenshot:
Alternatively, you could look into doing fully customized reporting using either a paid app from the marketplace or the Free Google sheets or Excel connector apps provided by Atlassian to pull live or snapshot Jira data into the external spreadsheets and use the spreadsheets reporting capabilities to build out a report as needed based on the data stream, Additional details on these options can be seen in:
The third-party apps have a lot of various features for Jira dashboard gadgets and would require a bit of research to locate the best one to fit your needs, but the Spreadsheet options do not have the ability to show on a Jira dashboard directly, but you could either add a Rich Text gadget and link teh spreadsheets in the gadget or use confluence instead to show the data. The google sheet can be linked as an iframe and displayed on a confluence page, but Excel doc would need to be manually linked to a page or it would also require an additional connector app to link the details dynamically in a similar way as google sheets in a confluence page.
Hope this info helps get you started and let me know if you have any follow up questions
Regards,
Earl
Thanks for your detailed answer it's very helpful and I was able to build some nice dashboard !
I also have another question regarding the field I can report on.
I can see the field I want on the scroll down menu, the field call Organization is a Custom one, I would like to know if I need a modify any setting ?
Thanks, appreciate your help.
You must be a registered user to add a comment. If you've already registered, sign in. Otherwise, register and sign in.

Was this helpful?
Thanks!
DEPLOYMENT TYPE
CLOUDPRODUCT PLAN
STANDARDAtlassian Community Events
- FAQ
- Community Guidelines
- About
- Privacy policy
- Notice at Collection
- Terms of use
- © 2024 Atlassian


You must be a registered user to add a comment. If you've already registered, sign in. Otherwise, register and sign in.