Community resources
Community resources
- Community
- Products
- Jira Service Management
- Questions
- Averege SLA Reports on JIRA
Averege SLA Reports on JIRA
Hi,
I'm struggling to understand logic behind this particular reporting that is built into JIRA. I did not find any useful details so far, i hope someone can help here, i believe solution is simple.
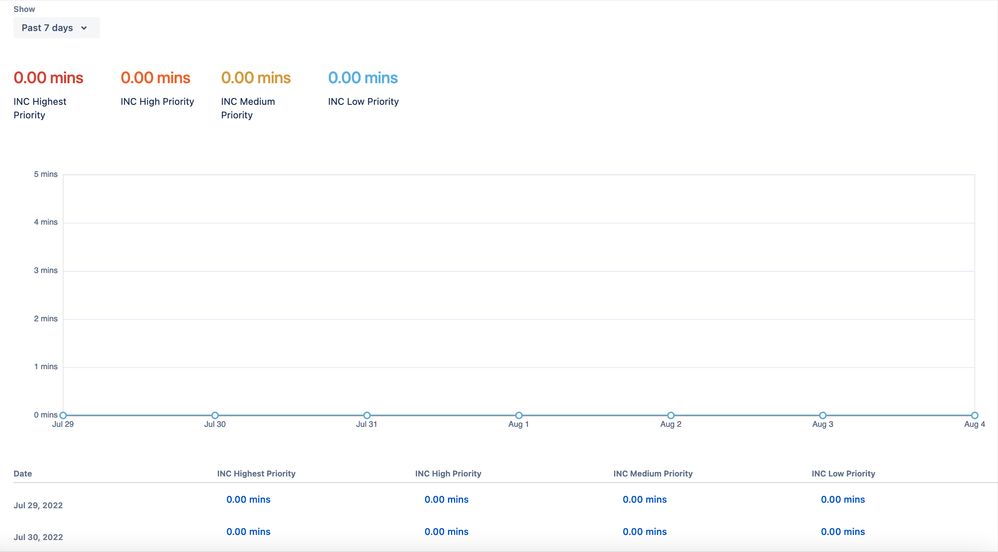
I have setup simple report based on incident priority and wanted to measure what is average time to resolve those, based on SLA. (Series is called SLA for resolution (avg.)). However I'm not sure why do i have dates on bottom of the graph? Why some of the days have very huge amount of hours on the graph and some of them don't.
For example: what exactly is taken in 7 days period? Based on that graph below looks like there was no average resolution for any of the priority. I don't get it why is that, some of the tickets were closed in last 7 days, some of them open. Why those data is not appearing on report?
I would appreciate if someone can explain me logic for this reporting.
0 answers
DEPLOYMENT TYPE
CLOUDPRODUCT PLAN
PREMIUMPERMISSIONS LEVEL
Site AdminAtlassian Community Events
- FAQ
- Community Guidelines
- About
- Privacy policy
- Notice at Collection
- Terms of use
- © 2024 Atlassian


