Community resources
Community resources
- Community
- Products
- Jira Align
- Articles
- The Math Behind the Jira Align Program Increment Progress and Scope Reports
The Math Behind the Jira Align Program Increment Progress and Scope Reports
If you have ever wondered how these Jira Align graphs and numbers are calculated, wonder no more!
Program Increment Progress Report:
This report consists of four burnup and burndown graphs, two are based on features and the other two based on stories. This page looks like this:
Let’s look at each graph individually:
Burndown by Feature

NOTE: Scope added or removed does not adjust the scope line in the burndown as it does in the burnup. Instead, the starting point of the scope line dynamically adjusts to always start with whatever the current points are in the PI. Think of the scope line as the ideal burn of story points based on the currently assigned points as of today.
This report goes off of Feature Acceptance dates and totals just the Accepted Stories under the Feature. In my small program, my PI has the following accepted features, by date:
|
Feature Accepted Date |
Sum of ALL Story Points on Feature |
Sum of Accepted Story Points on Feature |
|
2020-07-07 |
17 |
11 |
|
2020-07-14 |
8 |
8 |
|
2020-07-23 |
2 |
2 |
|
2020-08-20 |
21 |
11 |
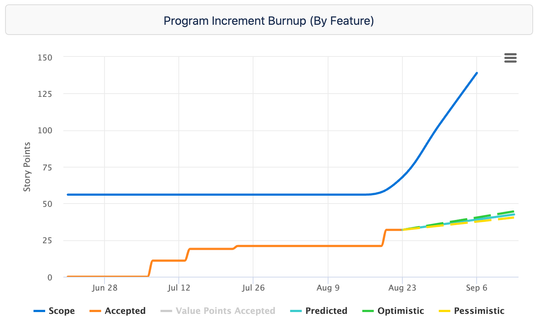
Comparing this data to the burndown chart, the accepted stories column matches each drop by date and number of points. Also, note the gray dashed line that indicates when the PI will end. Based on current velocity, in my example Jira Align is predicting that the work will not be finished within this PI.
Burnup by Feature
NOTE: The Burnup DOES move the scope line if you add scope, while the burndown does NOT show added scope. In the above chart, a large amount of scope was added between August 23rd and September 6th.
This report, like the burndown, looks at Feature Accepted dates, so looking at the same table as previous, I have these acceptance dates for my features:
|
Feature Accepted Date |
Sum of ALL Story Points on Feature |
Sum of Accepted Story Points on Feature |
|
2020-07-07 |
17 |
11 |
|
2020-07-14 |
8 |
8 |
|
2020-07-23 |
2 |
2 |
|
2020-08-20 |
21 |
11 |
This graph also matches the data when totaling all Accepted Stories under the Accepted Features.
Burndown by Story

NOTE: Scope added or removed does not adjust the scope line in the burndown as it does in the burnup. Instead, the starting point of the scope line dynamically adjusts to always start with whatever the current points are in the PI. Think of the scope line as the ideal burn of story points based on the currently assigned points as of today.
This graph is focused on Stories, so it is adding up all Accepted Stories in this Program Increment and/or a Sprint in this PI. Unlike the Feature burndown, this graph includes orphan stories {Stories assigned to a sprint in this PI or just the PI.} So to calculate this report, look at all Accepted Stories by Accepted Date:
|
Story Accepted Date |
Story Point Total |
|
2020-06-23 |
3 |
|
2020-07-01 |
8 |
|
2020-07-24 |
2 |
|
2020-08-04 |
2 |
|
2020-08-05 |
2 |
|
2020-08-15 |
4 |
Burnup by Story
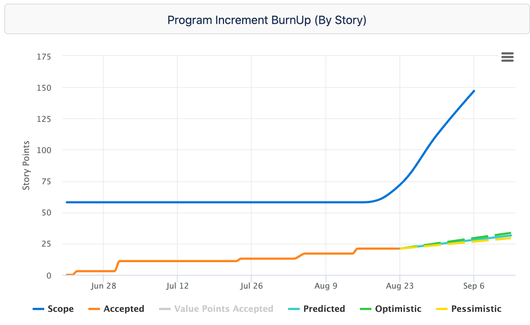
NOTE: The Burnup DOES move the scope line if you add scope, while the Burndown does NOT show added scope.
So, let’s take the Story data we already have from the previous example, a table of Story Accepted dates - being sure to count all stories in the Sprint and/or the PI:
|
Story Accepted Date |
Story Point Total |
|
2020-06-23 |
3 |
|
2020-07-01 |
8 |
|
2020-07-24 |
2 |
|
2020-08-04 |
2 |
|
2020-08-05 |
2 |
|
2020-08-15 |
4 |
This shows the data behind the chart - all stories, including orphans, completed by this program on a date within the PI Boundaries.
Program Increment Scope Report:
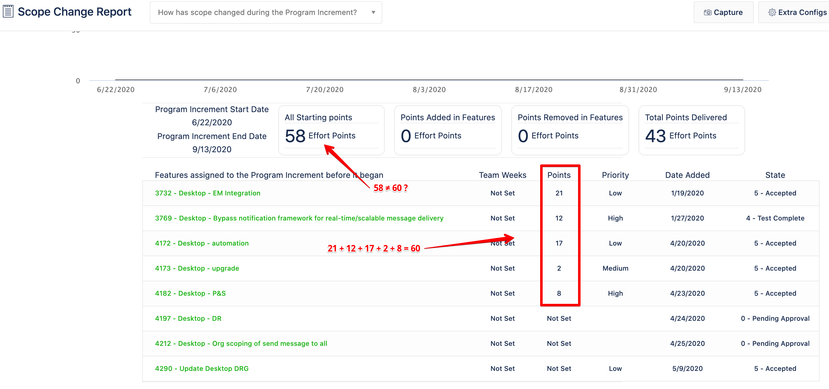
Have you ever looked at the Jira Align Program Increment Scope report and noticed that the total of the Points column may not be equal to the “All Starting Points” field at the top? Below is an example:
There are a few reasons why this might be the case:
If the Points column total is higher than the “All Starting Points” field at the top
The Points column is the sum total of all Story Points under your Features. This may include stories that are assigned to a different PI. If your report is showing a higher value in the Points column than the “All Starting Points” field at the top, as in this case, this is most likely why.
If the “All Starting Points” field at the top is higher than the Points column total
This can happen if you have orphan stories. Since the Points column only includes story points associated with features, it will not count any orphan stories that may be assigned to either the PI, one of your sprints, or both.
Was this helpful?
Thanks!
Peggy Graham

About this author
Customer Success Manager - Enterprise Cloud
Atlassian
Atlassian Community Events
- FAQ
- Community Guidelines
- About
- Privacy policy
- Notice at Collection
- Terms of use
- © 2024 Atlassian


6 comments