Community resources
Community resources
- Community
- Products
- Confluence
- Questions
- Link Different Tables to Overall Status Report Dashboard
Link Different Tables to Overall Status Report Dashboard
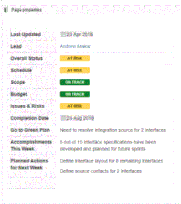
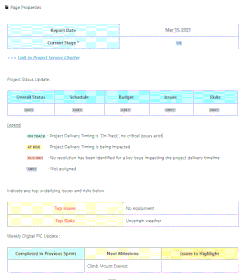
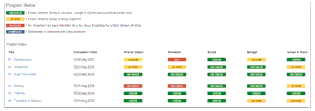
Hi, based on your Project Status Reporting with Atlassian Confluence (refer Table 1), can we create different tables to clearly indicate in the Overall project status report (refer Table 2)?


1 answer

Hi @Yasmin Nisyah ,
You may need additional apps to work with your final Page Properties Report macro and create different tables (pivots, visualized charts) to indicate different aspects of your project clearly.
For example, you may try the Table Filter and Charts for Confluence app.
Here are several examples how to filter your Page Properties Report, aggregate data and visualize it. Or you may watch this short video tutorial.
The only difference for the Cloud Confluence hosting is that you'll need to use the Table Toolbox macro to nest several macros inside each other due to the new editor limitations.

Was this helpful?
Thanks!
DEPLOYMENT TYPE
CLOUDPRODUCT PLAN
STANDARDTAGS
Atlassian Community Events
- FAQ
- Community Guidelines
- About
- Privacy policy
- Notice at Collection
- Terms of use
- © 2024 Atlassian


You must be a registered user to add a comment. If you've already registered, sign in. Otherwise, register and sign in.