Create Sign up Log in
Turn on suggestions
Auto-suggest helps you quickly narrow down your search results by suggesting possible matches as you type.
Showing results for
Community resources
Community resources
build result javascript loading
Deleted user April 25, 2017 edited
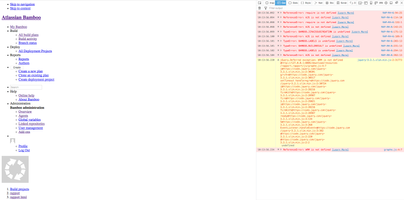
when I go to the build result page, none of the css of js is loaded :
sometimes it works when I refresh the page, but I still have a lot of jquery deprecation errors in the console.
I added a webpanel to the build result, here is the code :
freemarker template
<!DOCTYPE html>
<html>
<head>
	<meta charset="utf-8">
	<title>graphe erreurs</title>
	${webResourceManager.requireResource("rapport.rapport:simple-web-resource-pmd")}
	${webResourceManager.requireResource("rapport.rapport:simple-web-resource-style")}
	 <link rel="stylesheet" href="/download/resources/rapport.rapport/css/graphe.css">
	 <script src="https://code.jquery.com/jquery-3.2.1.slim.min.js"
			  integrity="sha256-k2WSCIexGzOj3Euiig+TlR8gA0EmPjuc79OEeY5L45g="
			  crossorigin="anonymous">
	</script>
	<script src="https://cdnjs.cloudflare.com/ajax/libs/Chart.js/2.5.0/Chart.bundle.min.js"
			  integrity="sha256-+q+dGCSrVbejd3MDuzJHKsk2eXd4sF5XYEMfPZsOnYE="
			  crossorigin="anonymous">
	</script>
	<script src="/download/resources/rapport.rapport/js/graphe.js" charset="utf-8"></script>
</head>
<body>
	<div class="resultat">
		<p id="path" hidden="true">/browse/${buildKey}-${buildNumber}/artifact/shared/</p>
		<figure>
			<canvas id="styleCanvas" width="400" height="400"></canvas>
			<figcaption> erreurs de style</figcaption>
		</figure>
		<figure>
			<canvas id="pmdCanvas" width="400" height="400"></canvas>
			<figcaption>erreurs de PMD</figcaption>
		</figure>
	</div>
</body>
</html>
atlassian-plugin
<web-panel name="graphe" i18n-name-key="graphe.name" key="graphe" location="chainresult.summary.right" weight="1000">
	<description key="graphe.description">The graphe Plugin</description>
	<resource name="view" type="freemarker" location="templates/viewResult.ftl" />
</web-panel>
js
$(document).ready(function () {
  'use strict';
  // The data key is [groupId].[artifactId]:[web-resource-key].[data-key]
  var styleTab = WRM.data.claim('rapport.rapport:simple-web-resource-style.simple-data-style').split(",");
  for (var i = 0; i < styleTab.length; i++) {
    styleTab[i] = styleTab[i].split(":");
  }
  var ctx = $('#styleCanvas');
  var erreurs = [];
  var warnings = [];
  var labels = [];

  for (var i = 0; i < styleTab.length - 1; i++) {
    erreurs[i] = styleTab[i][0]; // styleTab[i] contient erreurs, warnings
    warnings[i] = styleTab[i][1];
    labels[i] = "build n°" + (i + 1);
  }

  var style = new Chart(ctx, {
    type: 'line',
    data: {
      labels: labels,
      datasets: [{
        label: "nombre d'erreurs",
        fill: true,
        lineTension: .1,
        borderColor: "#C40",
        borderWidth: 1,
        backgroundColor: "rgba(204,68,0,.2)",
        borderCapStyle: 'butt',
        borderDash: [],
        borderDashOffset: 0.0,
        borderJoinStyle: 'miter',
        pointBackgroundColor: "#C40",
        pointBorderColor: "#822b00",
        pointBorderWidth: .5,
        pointHoverRadius: 5,
        pointRadius: 2,
        pointHitRadius: 10,
        data: erreurs,
        spanGaps: false,
      }, {
        label: "nombre de warnings",
        fill: true,
        lineTension: .1,
        borderColor: "#FD0",
        borderWidth: 1,
        backgroundColor: "rgba(255,221,0,.2)",
        borderCapStyle: 'butt',
        borderDash: [],
        borderDashOffset: 0.0,
        borderJoinStyle: 'miter',
        pointBackgroundColor: "#FD0",
        pointHoverRadius: 5,
        pointBorderWidth: .5,
        pointBorderColor: "#FB0",
        pointRadius: 2,
        pointHitRadius: 10,
        data: warnings,
        spanGaps: false,
      }]
    },
    options: {
      maintainAspectRatio: true,
      scales: {
        xAxes: [{
          display: true,
        }]
      },
      pan: {
        enabled: false,
        mode: 'xy'
      },
      zoom: {
        enabled: false,
        mode: 'y',
      }
    }
  });

  /***PMD***/
  var pmdTab = WRM.data.claim('rapport.rapport:simple-web-resource-pmd.simple-data-pmd').split(",");
  var context = $('#pmdCanvas');
  for (var i = 0; i < pmdTab.length; i++) {
    pmdTab[i] = pmdTab[i].split(":");
  }
  var faible = [];
  var moyen = [];
  var eleve = [];
  var label = [];

  for (var i = 0; i < pmdTab.length - 1; i++) {
    faible[i] = pmdTab[i][0];
    moyen[i] = pmdTab[i][1];
    eleve[i] = pmdTab[i][2];
    label[i] = "build n°" + (i + 1);
  }

  var pmd = new Chart(context, {
    type: 'line',
    data: {
      labels: label,
      datasets: [{
        label: "priorité élevée",
        fill: true,
        lineTension: .1,
        borderColor: "#C40",
        borderWidth: 1,
        backgroundColor: "rgba(204,68,0,.2)",
        borderCapStyle: 'butt',
        borderDash: [],
        borderDashOffset: 0.0,
        borderJoinStyle: 'miter',
        pointBackgroundColor: "#C40",
        pointBorderColor: "#822b00",
        pointBorderWidth: 1,
        pointHoverRadius: 5,
        pointRadius: 2,
        pointHitRadius: 10,
        data: eleve,
        spanGaps: false,
      }, {
        label: "priorité moyenne",
        fill: true,
        lineTension: .1,
        borderColor: "#FD0",
        borderWidth: 1,
        backgroundColor: "rgba(255,221,0,.2)",
        borderCapStyle: 'butt',
        borderDash: [],
        borderDashOffset: 0.0,
        borderJoinStyle: 'miter',
        pointBackgroundColor: "#FD0",
        pointHoverRadius: 5,
        pointBorderWidth: .1,
        pointBorderColor: "#cdb200",
        pointRadius: 2,
        pointHitRadius: 10,
        data: moyen,
        spanGaps: false,
      }, {
        label: "priorité faible",
        fill: true,
        lineTension: .1,
        borderColor: "#290",
        borderWidth: 1,
        backgroundColor: "rgba(34,153,0,.2)",
        borderCapStyle: 'butt',
        borderDash: [],
        borderDashOffset: 0.0,
        borderJoinStyle: 'miter',
        pointBackgroundColor: "#290",
        pointHoverRadius: 5,
        pointBorderWidth: 1,
        pointBorderColor: "#260",
        pointRadius: 2,
        pointHitRadius: 10,
        data: faible,
        spanGaps: false,
      }]
    },
    options: {
      maintainAspectRatio: true,
      scales: {
        xAxes: [{
          display: true,
        }]
      },
      pan: {
        enabled: false,
        mode: 'xy'
      },
      zoom: {
        enabled: false,
        mode: 'y',
      }
    },
  });
});
0 answers
- FAQ
- Community Guidelines
- About
- Privacy policy
- Notice at Collection
- Terms of use
- © 2024 Atlassian


